
 “Correlation does not imply causation” is a golden rule in data and science. Seeing a pattern is never enough to prove cause and effect.
Contents
Correlation and causation are two different statistical concepts. While they are often confused, knowing the difference prevents false conclusions.
Correlation
A statistical relationship where two variables move together (they covary). If one goes up, the other tends to go up or down. It does not prove that one makes the other happen. There are several types of correlation coefficient, but the most popular is Pearson’s. Pearson’s correlation (also called Pearson’s R) is a correlation coefficient commonly used in linear regression. If you’re starting out in statistics, you’ll probably learn about Pearson’s R first. In fact, when anyone refers to the correlation coefficient, they are usually talking about Pearson’s.
Key Properties
- Range: The correlation coefficient always falls between (-1) and (+1).
- +1: Perfect positive linear relationship.
- -1: Perfect negative linear relationship.
- 0: No linear relationship between the variables.
Causation
A direct cause-and-effect relationship where a change in one variable directly results in a change in the other. Causation can be extremely hard to prove, as what you’re trying to prove is 100 percent correlation (which rarely happens).
Take the case of cigarette smoking. For decades, activists, trade groups, and scientists debated about whether tobacco smoke caused lung cancer and if so, how strong was the link. Many other reasons were suggested for the link between lung cancer and smoking, including sleep deprivation or alcoholism. In layman’s terms, it’s now known that smoking causes lung cancer. But in scientific (or statistical) terms, you can’t really say “cause” as that would mean every single person who smoked even just one cigarette would get lung cancer. As statisticians, we say that there is a very strong correlation between smoking and lung cancer.
Confirmed by: Controlled experiments, randomized controlled trials (RCTs), or strong causal designs.
How do Correlation, Causation compare side by side?
The table below compares correlation and causation across 9 dimensions, from what it means through common error when confused.
| Dimension | Correlation | Causation |
|---|---|---|
| What it means | Two variables statistically move together | One variable directly produces a change in the other |
| Directionality | Symmetric — “A correlates with B” = “B correlates with A” | Asymmetric — cause precedes and produces effect |
| Typical measure | Pearson’s r (-1 to +1) or Spearman’s rho | Estimated treatment effect from a designed comparison (e.g., RCT, natural experiment) |
| Can be shown by | Any dataset with two measured variables | Randomization, controlled comparison, or strong quasi-experimental design |
| Confounding risk | High — a third variable can drive both | Minimized by random assignment or explicit statistical control |
| Time order required? | No — can be measured at a single point in time | Yes — cause must precede effect |
| Typical study design | Cross-sectional survey, observational cohort, secondary data analysis | Randomized controlled trial, natural experiment, well-controlled quasi-experiment |
| Common evaluation framework | Statistical significance, effect size, confidence interval | Bradford Hill criteria, replication, mechanism plausibility |
| Common error when confused | Overinterpreting an association as proof of a mechanism | Assuming a single study or dataset is sufficient without ruling out confounders |
References
“Correlation Coefficient.” Wikipedia, April 21, 2026. https://en.wikipedia.org/wiki/Correlation_coefficient.
“Correlation Coefficient: Simple Definition, Formula, Easy Calculation Steps.” Statistics How To, August 24, 2024. https://www.statisticshowto.com/probability-and-statistics/correlation-coefficient-formula/.
“Causation Definition & Causation vs. Correlation.” Statistics How To, December 15, 2014. https://www.statisticshowto.com/causation/.
Madhavan, Archana. “Correlation Vs Causation: Learn the Difference.” Amplitude, July 28, 2025. https://amplitude.com/blog/causation-correlation.
“Correlation Vs. Causation: The Difference.” July 30, 2026. CASRAI, https://casrai.org/compare/correlation-vs-causation.
“Correlation and Causation.” Australian Bureau of Statistics. Accessed November 5, 2026. https://www.abs.gov.au/statistics/understanding-statistics/statistical-terms-and-concepts/correlation-and-causation.
“Correlation Vs. Causation: What’s the Difference?” Coursera, August 18, 2023. https://www.coursera.org/articles/correlation-vs-causation.
A, Sindhuja. “Correlation Vs. Causation: Key Differences with Examples.” Editage Insights, June 5, 2025. https://www.editage.com/insights/correlation-vs-causation-key-differences-with-examples.
Bhandari, Pritha. “Correlation Vs. Causation.” Scribbr, July 12, 2021. https://www.scribbr.com/methodology/correlation-vs-causation/.
Videos
Have you heard this before: Correlation does not imply Causation. But could you explain why? Correlation, the idea that two things are happening together (either positively or negatively correlated) is a mathematical relationship. But Causation is a much more complicated idea. Does one thing CAUSE another. You can’t just calculate it. It’s more like you have to make a case to argue for causation.
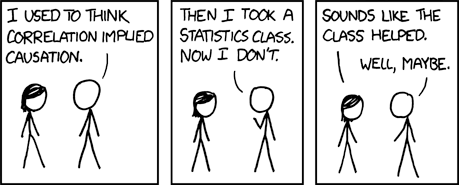
Causality means that there is a clear cause-effect relationship between two variables. Thus, there is causality if action A causes outcome B. A common mistake in the interpretation of statistics is that causality is inferred when a correlation is present. However, a correlation only indicates whether there is a connection.
Notes
confounding variable (or confounder)
A confounding variable (or confounder) is an extraneous third factor in a study that influences both the independent variable (the supposed cause) and the dependent variable (the effect), creating a false or distorted association between them. To be a true confounder, a variable must meet three conditions:
- It correlates with the exposure (the independent variable).
- It independently predicts the outcome (the dependent variable).
- It is not on the causal pathway (it is not a step or consequence in-between the exposure and outcome).
overinterpreting
Overinterpreting means reading too much into something, or giving a statement, action, data point, or event an unlikely, exaggerated, or unreasonable amount of importance and meaning. In statistics, deriving sweeping conclusions or claiming absolute proof from data when results are statistically uncertain, trivially small, or extrapolated past safe limits.
Bradford Hill criteria
The Bradford Hill criteria (also known as Hill’s viewpoints) are a group of nine principles introduced by British epidemiologist Sir Austin Bradford Hill in 1965 to help evaluate whether an observed association between an exposure and an outcome is causal.
RCT
Randomized controlled trial (RCT) statistics involve analyzing and interpreting data from experiments where participants are randomly assigned to treatment or control groups to measure cause-and-effect relationships.
natural experiment
A natural experiment is an observational study in which an external event, policy change, or natural process splits a population into “treated” and “control” groups in a way that mimics random assignment.
The featured image on this page was created using ChatGPT.