Mercator Projection
Mercator is a conformal cylindrical map projection that was originally created to display accurate compass bearings for sea travel. An additional feature of this projection is that all local shapes are accurate and correctly defined at infinitesimal scale. Directions, angles, and shapes are maintained at infinitesimal scale. Any straight line drawn on this projection represents an actual compass bearing. These true direction lines are rhumb lines [RL] and generally do not describe the shortest distance between points. Distances are true along the equator or along the secant latitudes (standard parallels). [1]
Uses of Mercator Projection
- The Mercator projection is significant for navigation, and almost every marine chart is based on it.
- Street mapping services such as Google Maps, Bing Maps, MapQuest, etc., use a Mercator called Web Mercator for their map images.
- Mercator projections were vital for the mathematical development of plate tectonics during the 1960s. [2]
Facts About Mercator Projection
- The parallels and meridians on the Mercator are straight and perpendicular to one another. This phenomenon is typical among all cylindrical projections.
- The Mercator is a conformal map projection which means that the angles around all locations are preserved.
- All latitudes beyond 70 degrees north or south of the Mercator projection are unusable as the linear scale becomes infinitely large at the poles.
- A Mercator map can fully show the polar areas.
- The two features of a Mercator map – conformality and straight rhumb lines [RL] – make the projection uniquely appropriate for navigation.
- The Mercator projection was the most commonly used projection for world maps during the 19th and 20th centuries. [2]
How are different map projections used?
The method used to portray a part of the spherical Earth on a flat surface, whether a paper map or a computer screen, is called a map projection. No flat map can rival a globe in truly representing the surface of the entire Earth, so every flat map misrepresents the surface of the Earth in some way. A flat map can show one or more–but never all–of the following:
- True directions
- True distances
- True areas
- True shapes
Different projections have different uses. Some projections are used for navigation, while other projections show better representations of the true relative sizes of continents.
For example, the basic Mercator projection yields the only map on which a straight line drawn anywhere within its bounds shows a true direction, but distances and areas on Mercator projection maps are grossly distorted near the map’s polar regions. On an equidistant map projection, distances are true only along particular lines, such as those radiating from a single point selected as the center of the projection. Shapes are more or less distorted on every equal-area map.
The scale of a map on any projection is often crucial to the map’s usefulness for a given purpose. For example, the extreme distortion that is present at high latitudes on a small-scale Mercator map of the World disappears almost completely on a properly oriented Transverse Mercator map of a small area in the same high latitudes. A large-scale (1:24,000) 7.5-minute USGS topographic map based on the Transverse Mercator projection is nearly correct in every respect. [3]
This map projection is practical for nautical applications due to its ability to represent lines of constant course, known as rhumb lines, as straight segments that conserve the angles with the meridians. Although the linear scale is equal in all directions around any point, thus preserving the angles and the shapes of small objects, the Mercator projection distorts the size of objects as the latitude increases from the equator to the poles, where the scale becomes infinite. [7]
Mathematics Behind the Map
The math is cool 👓 but somewhat involved. Therefore, I encourage you to visit the Mercator’s Projection web page [5], and other references noted below it, to view the details not included in this section.
The property of the Mercator projection map that made it useful to navigators is that it preserves angles [6]. Lines of constant compass heading (called rhumb lines [RL] by sailors) are straight lines on this map.
In 1599 the English mathematician Edward Wright explained the mathematics of exactly how Mercator’s projection should be done. Let’s say that the distance on Mercator’s map from the equator to the parallel at latitude θ is F(θ), in units where the equator has length 2π on the map. After some calculations, taking the equator as height 0, so F(0) = 0, we can write it as a definite integral:
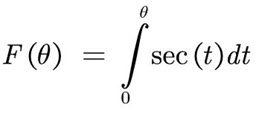
That’s not quite the language Wright uses (this was before the invention of calculus), but it amounts to the same thing. [5] (Note that the projection is based on the trigonometric identity secant! 😲)
Wright didn’t know didn’t know about logarithms yet, and as we’ll see we need logarithms to write down the answer. So what Wright did was to do the integration approximately, using sums with an interval of 1 minute of arc = 1/60 degree, for all latitudes up to 75 degrees. It must have taken a lot of effort back in those days. His table was published, and was quite useful for mapmakers.
In 1614 John Napier invented logarithms, and they were soon found to be quite useful in calculations. So useful that not only tables of logarithms, but tables of logarithms of trigonometric functions, were published, including in 1620 a table of logarithms of tangents.
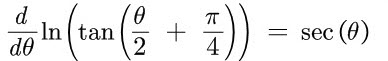
In the 1640’s a man by the name of Henry Bond happened to be looking at two tables at the same time: Wright’s table of F(θ) and a table of logarithms of tangents. He noticed a coincidence: F(θ) seemed to be the same as ln( tan(θ/2) + π/4) ). He published this as a conjecture in 1645:
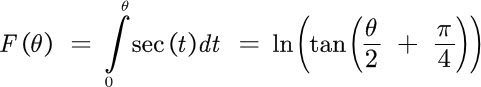
Nowadays, all you would have to do to verify this is note that they agree at θ = 0, differentiate, and use a few trigonometric identities:
What did we learn?
- The Mercator map has its meridians of longitude placed vertically and spaced equally. The parallels of latitude are horizontal and unequally spaced. Edward Wright’s great achievement was to show that the parallel at latitude θ should be stretched by a factor of sec(θ) when drawn on the map. [5d]
- Any straight line drawn on this projection represents an actual compass bearing.
Gerardus Mercator
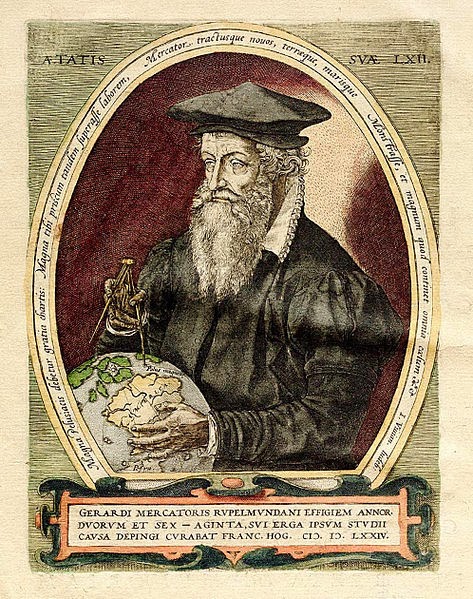
Gerardus Mercator was a famous Flemish cartographer during the Renaissance period who first coined the term ‘atlas’ for the maps he created. He collected reports from travelers to distant parts of the world and pieced together the information to create the maps. As he was a good cartographer he was able to depict the correct topography of area for which he created the map. The maps were very accurate at the center but were often distorted at the edges. This was probably due to the fact that he used the longitudes and latitudes as straight lines running parallel to each other from the top to the bottom and from side to side. He was the first person to use the term ‘North America’ in his maps and showed the ‘New World’ on his maps as stretching from the North to the Southern hemispheres. His maps became the sole guide for people venturing into the unknown over the land and the sea. He lived during the time of ‘reformations’ in Europe and was suspected to be a Lutheran and imprisoned for seven months. He started making maps when the world was opening up to the Europeans voyagers and travelers rapidly. [4]
Latitude and Longitude
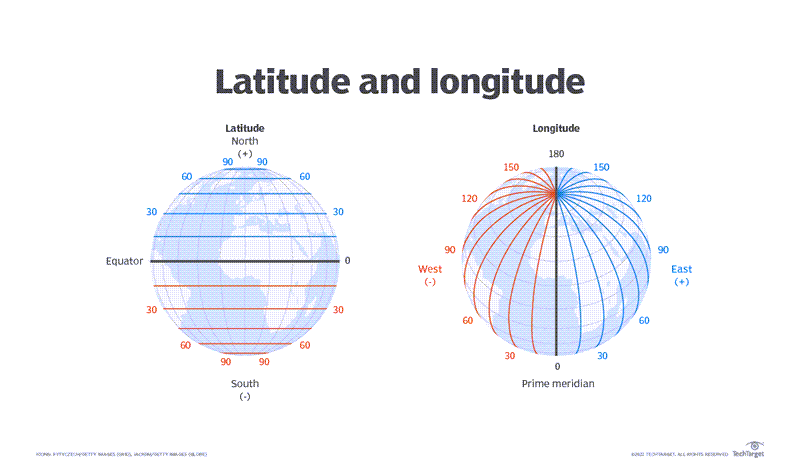
Latitude and longitude are parameters or coordinates that help determine the location of any place on Earth. Both latitude and longitude are angles that uniquely define points on the Earth’s sphere. They constitute a coordinate system or scheme to locate or identify geographic positions anywhere on the Earth’s surface.
Latitudes are horizontal lines that measure distance north or south of the equator. Longitudes are vertical lines that measure east or west of the meridian in Greenwich, England. Together, latitude and longitude enable cartographers, geographers and others to locate points or places on the globe. They also show the angular distance of any place from the Earth’s center. Latitude and longitude are both measured in degrees (°) and minutes (′). [8]
References
[1] “Mercator—ArcGIS Pro | Documentation”. 2023. pro.arcgis.com. https://pro.arcgis.com/en/pro-app/latest/help/mapping/properties/mercator.htm.
[2] “Mercator Projection”. 2023. Vedantu. https://www.vedantu.com/geography/mercator-projection.
[3] “How are different map projections used?”. 2023. USGS. https://www.usgs.gov/faqs/how-are-different-map-projections-used.
[4] “Who Was Gerardus Mercator? Everything You Need To Know”. 2023. thefamouspeople.com. https://www.thefamouspeople.com/profiles/gerardus-mercator-7508.php.
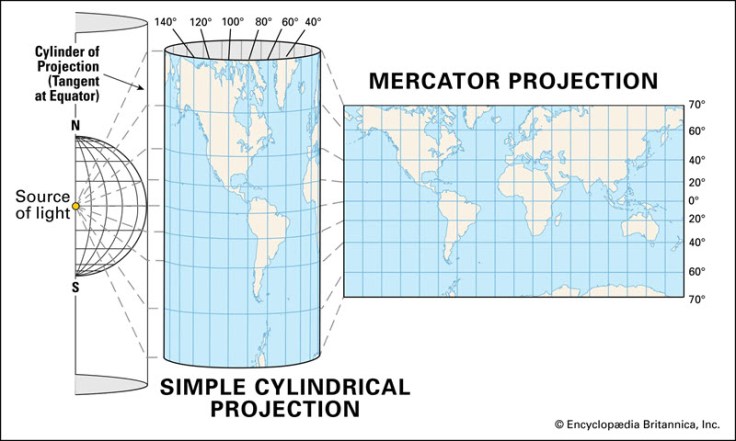
The Mercator projection is a cylindrical map projection presented by the Flemish geographer and cartographer – Gerardus Mercator – in 1569. Now, you may ask what a cylindrical map projection is. In Cartography, any map projection of the terrestrial sphere done on the surface of a cylinder unrolled as a plane is known as a cylindrical projection. Mercator projection became the standard projection for navigation due to its ability to conserve lines of constant course; that is, it represents the north as up and south as down everywhere while preserving local directions and shapes. The Mercator projection is derived mathematically. The meridians are equally spaced vertical lines, and the latitudes are parallel horizontal straight lines that are spaced farther apart as the distance from the Equator increases.
The prime detriment of the Mercator projection is that it inflates the size of objects away from the Equator. The inflation is minuscule near the Equator and increases latitude, and becomes infinite at the poles. The result of such distortion is that areas like Greenland and Antarctica appear much more extensive than they are. For example, on a Mercator projection, the landmass of Greenland appears greater than that of the continent of South America; although, Greenland is even smaller than the Arabian Peninsula.
[5] ⭐ “Mercator’s Projection”. 2023. personal.math.ubc.ca. https://personal.math.ubc.ca/~israel/m103/mercator/mercator.html.
[5a] “100 Years To Solve An Integral – Lior Sinai”. 2023. liorsinai.github.io. https://liorsinai.github.io/mathematics/2020/08/27/secant-mercator.html.
The integral of sec(x) is well known to any beginners calculus student. Yet this integral was once a major outstanding maths problem. It was first introduced by Geradus Mercator who needed it to make his famous map in 1569. He couldn’t find it and used an approximation instead. The exact solution was found accidentally 86 years later without calculus in 1645. It then took another two decades until a formal proof was given in 1668, 99 years after Mercator first proposed the problem.
[5b] “Map Projection”. 2023. usna.edu. https://www.usna.edu/Users/oceano/pguth/md_help/html/mapb0iem.htm.
[5c] “Mercator Projection – Wikipedia”. 2023. en.wikipedia.org. https://en.wikipedia.org/wiki/Mercator_projection#Properties.
[5d] ⭐ Rickey, V. Frederick and Philip M. Tuchins. “An Application of Geography to Mathematics: History of the Integral of the Secant” 2023. maa.org. https://www.maa.org/sites/default/files/0025570×15087.di021115.02p0115x.pdf.
[6] ⭐ “How to show that the Mercator projection preserves angles”. 2020. Mathematics Stack Exchange. https://math.stackexchange.com/questions/3717755/how-to-show-that-the-mercator-projection-preserves-angles.
[7] Fletcher, Steven J. “Numerical Modeling on the Sphere”, 2023. “Mercator Projection – an overview | ScienceDirect Topics”. https://www.sciencedirect.com/topics/earth-and-planetary-sciences/mercator-projection.
[8] ⭐ “What is latitude and longitude?”. 2023. whatis.com. https://www.techtarget.com/whatis/definition/latitude-and-longitude.
[RL] “Pythagoras on Mercator’s Map”. 2021. Mathematics Stack Exchange. https://math.stackexchange.com/questions/4027331/pythagoras-on-mercators-map/4029457#4029457.
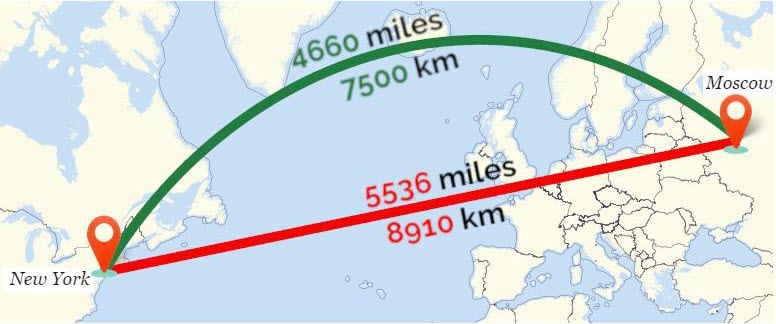
There is not a single consistent scale distortion on the map. The top two corners of that square (near the north and south poles) are closer together than the bottom two corners (near the equator) are. The straight-line path from one point to another on the Earth is not a straight line on the Mercator projection, unless the two points are both on the equator or have the same longitude. Here is an image I (RavenclawPrefect) found that shows an example of the straight-line path (red) on a Mercator projection versus the shortest distance on the sphere (green):
To find the true distance between two points given their latitude and longitude, the Calculate distance, bearing and more between Latitude/Longitude points web page, has a calculator, relevant formulas, and example code to compute the distance.
See “Rhumb Line – Wikipedia”. 2017. en.wikipedia.org. https://en.wikipedia.org/wiki/Rhumb_line.
Additional Reading
“Complex exponentials and the math behind Mercator’s projection”. 2018. Mathematics Stack Exchange. https://math.stackexchange.com/questions/2658944/complex-exponentials-and-the-math-behind-mercators-projection.
Daners, Daniel. “The Mercator and stereographic projections, and many in between”. 2011. https://www.maths.usyd.edu.au/u/daners/publ/abstracts/mercator/mercator.pdf.
We consider a family of conformal (angle preserving) projections of the sphere onto the plane. The family is referred to as the Lambert conic conformal projections. Special cases include the Mercator map and the stereographic projection. The techniques only involve elementary calculus and trigonometry.
“Gerardus Mercator – Wikipedia”. 2023. en.wikipedia.org. https://en.wikipedia.org/wiki/Gerardus_Mercator.
Mercator was a highly influential pioneer in the history of cartography Along with Gemma Frisius and Abraham Ortelius, he is generally considered one of the founders of the Netherlandish school of cartography and geography. He is also widely considered the most notable figure of the school. In his own day, he was a notable maker of globes and scientific instruments. In addition, he had interests in theology, philosophy, history, mathematics and geomagnetism. He was also an accomplished engraver and calligrapher. Unlike other great scholars of the age, he travelled little and his knowledge of geography came from his library of over a thousand books and maps, from his visitors and from his vast correspondence (in six languages) with other scholars, statesmen, travellers, merchants and seamen. Mercator’s early maps were in large formats suitable for wall mounting but in the second half of his life, he produced over 100 new regional maps in a smaller format suitable for binding into his Atlas of 1595. This was the first appearance of the word Atlas in reference to a book of maps. However, Mercator used it as a neologism for a treatise (Cosmologia) on the creation, history and description of the universe, not simply a collection of maps. He chose the word as a commemoration of the Titan Atlas, “King of Mauretania”, whom he considered to be the first great geographer.
“How do sailors use a Mercator projection map?”. 2023. Quora. https://www.quora.com/How-do-sailors-use-a-Mercator-projection-map.
There is no way to flatten a spherical surface (the Earth) into a flat representation (nautical chart) without some distortion of the land masses nearby (except on charts showing very small areas (harbor charts). Therefore projection systems are used to create nautical charts, Mercator being one of those projection methods, and the one most used for boat navigation.
“Map projection, An intro for multivariable calculus”. 2023. marksmath.org. https://www.marksmath.org/classes/common/MapProjection.pdf.
In multivariable calculus, we study higher dimensional calculus, i.e. derivatives and integrals applied to functions mapping ℝm to ℝn. Viewed in this context, the study of map projection is quite natural since we are mapping the surface of a globe to planar rectangle. The globe is naturally parameterized in terms of two variables, latitude ϕ and longitude θ. Thus, we could think of a map projection as a function T : ℝ2 → ℝ2 or T(ϕ, θ) = (x(ϕ, θ), y(ϕ, θ)).
“Mercator Projection – GIS Wiki | The GIS Encyclopedia”. 2023. wiki.gis.com. http://wiki.gis.com/wiki/index.php/Mercator_projection.
⭐ “Mercator Projection – Wikipedia”. 2023. en.wikipedia.org. https://en.wikipedia.org/wiki/Mercator_projection.
The Mercator projection is a cylindrical map projection presented by Flemish geographer and cartographer Gerardus Mercator in 1569. It became the standard map projection for navigation because it is unique in representing north as up and south as down everywhere while preserving local directions and shapes. The map is thereby conformal. As a side effect, the Mercator projection inflates the size of objects away from the equator. This inflation is very small near the equator but accelerates with increasing latitude to become infinite at the poles. As a result, landmasses such as Greenland, Antarctica, Canada and Russia appear far larger than they actually are relative to landmasses near the equator, such as Central Africa.
“Mercator Projection — From Wolfram MathWorld”. 2023. mathworld.wolfram.com. https://mathworld.wolfram.com/MercatorProjection.html.
The Mercator projection is a map projection that was widely used for navigation since loxodromes are straight lines (although great circles are curved). The following equations place the x-axis of the projection on the equator and the y-axis at longitude λ0, where λ is the longitude and Φ is the latitude.
“Mercator Projection Facts”. 2023. wreningham.norfolk.sch.uk. http://www.wreningham.norfolk.sch.uk/documents/Mercator_factsfile.pdf.
A map’s depiction of the Earth’s surface is a distortion because it is attempting to fit a curved surface onto a flat sheet. This is explained by the Mercator Projection, which is a cylindrical projection of a map in a way that all latitudes have the same length as the equator. This is usually used in modern cartography, marine charts, and several maps used for climatology and meteorology.
Pápay, Gyula. 2022. “Mercator’s Geometric Method In The Construction Of His Projection From 1569”. KN – Journal Of Cartography And Geographic Information 72 (4): 261-267. doi:10.1007/s42489-022-00115-5.
The geometric method Mercator used to construct his projection from 1569 was reconstructed. Modern mathematical means are required for the computational creation of Mercator’s projection. It could be proven that Mercator worked out his projection exclusively with compass and linear. The methodological principles established by Ptolemy were used and further developed by Mercator. However, he did not describe his method and so an enigma of Mercator projection emerged.
“Projection Types—ArcMap | Documentation”. 2023. desktop.arcgis.com. https://desktop.arcgis.com/en/arcmap/latest/map/projections/projection-types.htm.
Because maps are flat, some of the simplest projections are made onto geometric shapes that can be flattened without stretching their surfaces. These are called developable surfaces. Some common examples are cones, cylinders, and planes. A map projection systematically projects locations from the surface of a spheroid to representative positions on a flat surface using mathematical algorithms.
The first step in projecting from one surface to another is creating one or more points of contact. Each contact is called a point (or line) of tangency. A planar projection is tangential to the globe at one point. Tangential cones and cylinders touch the globe along a line. If the projection surface intersects the globe instead of merely touching its surface, the resulting projection is a secant rather than a tangent case. Whether the contact is tangent or secant, the contact points or lines are significant because they define locations of zero distortion. Lines of true scale include the central meridian and standard parallels and are sometimes called standard lines. In general, distortion increases with the distance from the point of contact.
“Pythagoras on Mercator’s Map”. 2021. Mathematics Stack Exchange. https://math.stackexchange.com/questions/4027331/pythagoras-on-mercators-map/4029457#4029457.
I cannot help but wonder whether measuring (and finding true distance after correcting scale distortion) of the horizontal and vertical displacement, and using the Pythagoras theorem will give the length of the path on the Mercator’s map? Why/Why not.
To find the true distance between two points given their latitude and longitude, this site has a calculator, relevant formulas, and example code to compute the distance.
“Simpler mathematic formula to find latitude coordinate mapping to lines “equally sized” on mercator projection?”. 2011. Mathematics Stack Exchange. https://math.stackexchange.com/questions/76229/simpler-mathematic-formula-to-find-latitude-coordinate-mapping-to-lines-equally.
“Using The Mercator Map Projection | maphover Interactive World Maps”. 2023. maphover.com.au. http://maphover.com.au/mercator-map-projection/.
Vis, Marc. “History of the Mercator projection”. 2018. https://studenttheses.uu.nl/bitstream/handle/20.500.12932/30719/History%20of%20the%20Mercator%20projection.pdf?sequence=2.
The Mercator projection is one of the most well-known projections, and nearly everyone has probably seen a map in this projection, e.g. in an atlas or as wall map (maybe without noticing or recognizing it as such though). Although often criticized nowadays, mainly because of the distortion in the areas towards the pole (leading to reactions like: ”I didn’t realize Greenland is that large!”), it has been of immense value in the past, especially for navigation at sea. Also many of the sea charts used nowadays still make use of the Mercator projection.
The concept behind the Mercator projection seems pretty straightforward, and the projection itself rather simple, especially when compared to several of the more recently developed projections. However, as we will see in this thesis, after the first map in this projection was developed by Mercator, more than a century passed until the mathematics underlying the projection was fully understood and proved.
The thesis is written in such a way that people with some basic knowledge in calculus should be able to follow.
“Who Is The Man Behind The Mercator Map?”. 2023. ThoughtCo. https://www.thoughtco.com/gerardus-mercator-maps-1435695.
Gerardus Mercator was a Flemish cartographer, philosopher, and geographer who is best known for his creation of the Mercator map projection. On the Mercator projection parallels of latitude and meridians of longitude are drawn as straight lines so that they are useful for navigation. Mercator was also known for his development of the term “atlas” for a collection of maps and his skill in calligraphy, engraving, publishing, and the making of scientific instruments. In addition, Mercator had an interests in mathematics, astronomy, cosmography, terrestrial magnetism, history and theology.
⭐ “Why is the area from the equator to latitude x proportional to tan x?”. 2017. Mathematics Stack Exchange. https://math.stackexchange.com/questions/2086174/why-is-the-area-from-the-equator-to-latitude-x-proportional-to-tan-x.
Videos
Overview of many different types of map projections, how they came to be, and what each one may be used for. I discuss the general characteristics as well as looking at specific projections to determine which ones are the best and worst.
Overview of many different types of map projections, how they came to be, and what each one may be used for. I discuss the general characteristics as well as looking at specific projections to determine which ones are the best and worst.
Video as part of a course by Emarin Norway. Explaining the sacrifices made to convert the earths spherical surface into a flat, navigable map.
⭐ I suggest that you read the entire reference. Other references can be read in their entirety but I leave that up to you.
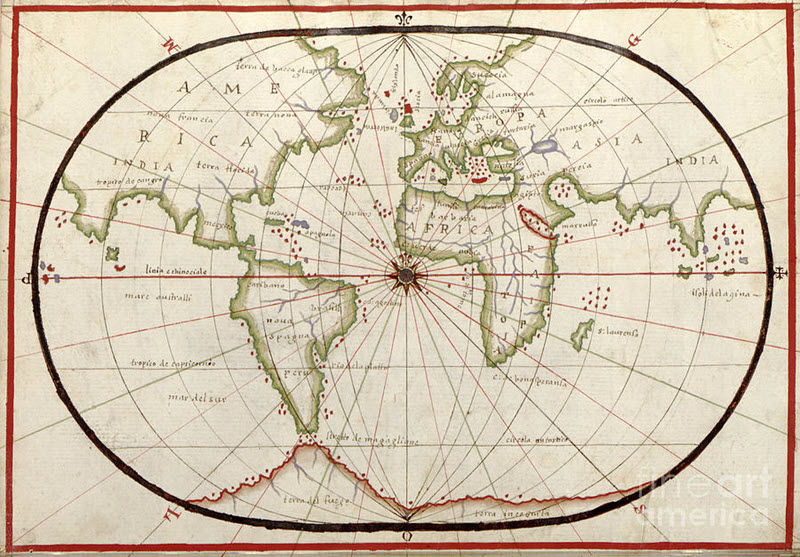
The featured image on this page is from the fineartamerica website.
