Contents
Definition
Percentage difference measures the difference between two different experimental values where one value is higher than the other. In other words, the percentage difference is defined as the absolute value of the ratio of the difference between two numbers and their average, expressed as a percentage.

Percentage Difference Formula
Example
Calculate the percentage difference between the numbers 35 and 65.
Let us first assume that a = 65 and b = 35.
- Find the difference between two numbers, i.e., | a – b | = 65 – 35 = 30.
- Find the average of two numbers, i.e., (a + b)/2 = (65 + 35)/2 = 100/2 = 50.
- Take the ratio of the difference and the average, | a – b |/((a + b)/2) = 30/50 = 3/5.
- Multiply this by 100 ⇒ 3/5 × 100% = 60%.
Thus, the percent difference = 60%.
Key Points
Useful for comparing disparate values: When comparing values, percentage difference helps level the playing field by considering the relative change rather than the absolute difference.
Interpretation: A higher percent difference indicates a larger relative disparity between the two values, while a smaller percent difference suggests they are more similar proportionally.
Relative comparison: Unlike simply subtracting two values, the percent difference considers the scale of the values by dividing the difference by their average, providing a more meaningful comparison.
Wide applicability: A percentage difference can be used to compare various data sets, such as sales figures across different time periods, product price differences, or performance metrics between individuals or teams.
Interpretation ease: Expressing the difference as a percentage makes understanding the magnitude of the disparity between two values intuitive.
Magnitude of the percentage: The absolute value of the percent difference shows the degree of difference between the two values, with a larger percentage indicating a larger relative difference.
When to Use
When both values mean the same kind of thing (for example the heights of two people).
Calculate the percentage difference between the initial and new values to understand how much a value has changed compared to a reference point.
When analyzing trends in data over time, the percent difference can reveal the relative rate of change.
In finance, the percentage difference is used to understand how close two values are.
In business, percentage difference can be used to compare how an investment is performing to similar investments.
Interpreting Percentage Differences
To accurately interpret percentage difference, it’s essential to consider context, actual values, directionality, and proper application of the formula. Awareness of these common pitfalls can lead to more informed and accurate analyses.
1. Ignoring Context
- Mistake: Failing to consider the context in which the values were obtained.
- Consequence: A percentage difference might seem significant in one context (e.g., financial metrics) but trivial in another (e.g., experimental measurements).
2. Focusing Solely on Magnitude
- Mistake: Paying too much attention to the percentage value without considering the actual values being compared.
- Consequence: A high percentage difference may not be meaningful if the actual values are very small (e.g., a 50% difference between 1 and 1.5).
3. Misunderstanding Directionality
- Mistake: Assuming that percentage difference indicates which value is larger.
- Consequence: Percentage difference only shows how much the two values differ, not which one is greater.
4. Misapplying the Formula
- Mistake: Using the formula incorrectly, such as ignoring the absolute value or not averaging the two values.
- Consequence: This can lead to incorrect calculations and interpretations.
5. Overlooking Units
- Mistake: Comparing values with different units without proper conversion.
- Consequence: This can result in misleading interpretations, as percentage difference should only be applied to comparable values.
6. Neglecting Sample Size
- Mistake: Not considering the sample size when interpreting percentage differences in datasets.
- Consequence: A large percentage difference in a small sample might not be statistically significant.
7. Confusing with Percent Change
- Mistake: Mixing up percentage difference with percent change, which measures the relative change from an initial value to a final value.
- Consequence: This can lead to misunderstandings about whether the values are increasing or decreasing.
8. Failing to Analyze Trends
- Mistake: Looking at a single percentage difference without considering changes over time or across multiple instances.
- Consequence: This can mask underlying trends or patterns that are important for analysis.
Explanation
To help clarify the concept of percentage difference, let’s consider an example. Suppose on day one of ticket sales, we sell 15 tickets. On day two, we sell 25 tickets. What is the percentage difference in the tickets sales and what can we infer from the percentage difference?
First, let’s calculate the percentage difference for our example.

Next, we will graph the percentage difference along with the numerator and denominator of the equation to observe how they influence the percentage difference. The graph will display the following functions, and we will use the graph below to help us understand the percentage difference in our example and assist us when interpreting any future calculations of percentage difference.
y1 is the percent difference
y2 is the average (denominator)
y3 is the difference (numerator)
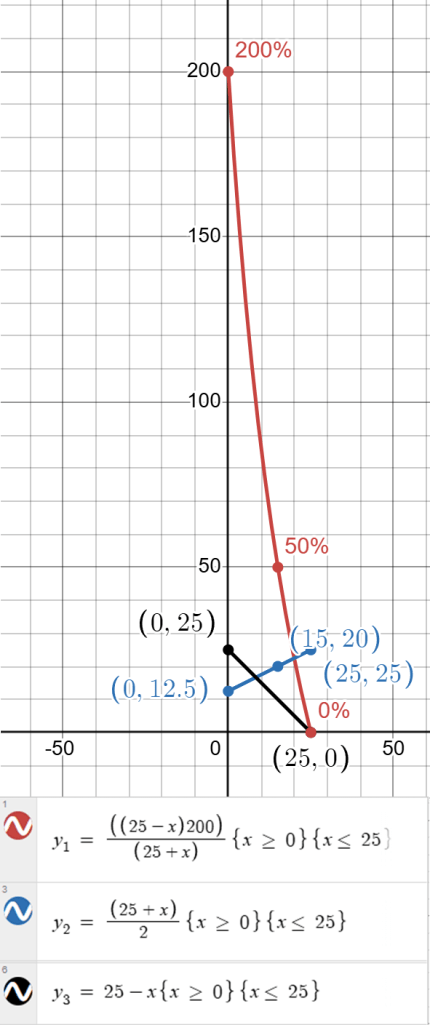
One of the first things to note from our graph is that the percentage difference (y1) is not linear. We also limit our results to a minimum of zero and a maximum of the largest value being compared. These observations will help us understand what happens at the extremes, i.e., when we have not sold any tickets on day one and 25 tickets the next day, we sell 25 tickets on days one and two, and how the percentage difference changes as we consider different day-one ticket sales, i.e., ticket sales less than 25 tickets.
Percentage is a special case of proportion. Proportion is just any positive fraction while percentage has a fixed denominator equal to 100. Both proportion and percentage can be written as fractions. The percentage is out of 100. The proportion is out of any given total.
As we examine the example and its graph, we note the following.
- The graph shows that a higher percentage difference indicates a larger disparity between the two values, while a lower percentage difference signifies a smaller discrepancy. (Please see Interpreting Percentage Differences above.)
- The difference between 25 tickets being sold and a ticket sale of 15 tickets is 10 tickets (numerator), the average is 20 tickets (denominator), and the calculated percentage difference is 50%. This illustrates that the percentage difference measures how much two values differ relative to their average.
- Suppose we were to compare ticket sales of 20 and 25. We then calculate that the percentage difference is ≅ 22%. This calculated percentage difference shows a smaller difference in ticket sales. (Please see Interpreting Percentage Differences above.)
- We notice that the slope of the difference (numerator) shown in y3, decreases and eventually reaches zero. Additionally, the slope of the average (denominator) shown in y2, increases and is never equal to zero.
What Did We Learn
Using percentage difference provides the following benefits.
- Makes it easier for stakeholders to understand the significance of the differences between two values without needing to interpret raw data.
- Allows for a relative comparison between two values, making it easier to understand their relationship.
Alternate Definitions
The percentage difference measures how much two values differ relative to their average. It provides a sense of the scale of the difference in percentage terms, making it easier to compare differences across various contexts. A higher percentage difference indicates a larger disparity between the values, while a lower percentage difference indicates a smaller discrepancy.
The percent difference, or difference between percentages, is a calculation you can apply to find how far apart two values are on a number line. In sales, finance, and accounting, the percent difference can represent various values that show different metrics that companies track and evaluate to achieve objectives. For instance, if a sales team wants to know the difference between a previous period’s percentage of sales and the current period’s, they can subtract these two values to find how much the current value changes. You can use the percent difference to calculate the percent of change, which is essential for tracking percent increases and decreases across a variety of business metrics.
A “percent difference” signifies the relative difference between two values, expressed as a percentage of their average, allowing for a meaningful comparison between values even when their absolute sizes are vastly different; it essentially tells you how much one value deviates from another in relation to their combined midpoint, providing insight into the proportional change between them rather than just the raw difference.
The percent difference formula is significant because it allows you to compare the relative difference between two values by expressing that difference as a percentage of their average, making it easier to understand the scale of the difference across various contexts, especially when comparing values with different magnitudes; a higher percent difference indicates a larger disparity between the two values, while a lower percent difference signifies a smaller discrepancy.
A percent difference result shows how much one value differs from another, expressed as a percentage of the average of those two values. Essentially, it indicates the relative size of the difference between the two values compared to their average. A higher percentage signifies a larger relative difference between the two values.
A “percent difference” measures the magnitude of the difference between two values, expressed as a percentage. It shows how much one value differs from another relative to their average, providing context for comparison. This measure indicates how far apart the two numbers are in relation to their midpoint, without considering which value is larger or smaller.
References
The Percentage Difference between 64.24% and 74.24% – Math Central. 2025. math central. Accessed January 26. https://mathcentral.uregina.ca/qq/database/qq.09.06/h/other1.html.
Indeed Editorial Team. “Percentage Difference vs Percentage Change (Formulas & Examples).” 2024. indeed. September 20. https://au.indeed.com/career-advice/career-development/percentage-difference-calculator.
Mendoza, Camille Ira B. “How to Calculate Percent Difference – Definition, Formula, Examples.” 2024. Brighterly. November 12. https://brighterly.com/math/percent-difference/.
“Percentage Difference Calculator – Free Online Calculator.” 2022. BYJUS. BYJU’S. October 24. https://byjus.com/percentage-difference-calculator/.
Indeed Editorial Team. “How to Calculate Percent Difference (With Examples).” 2024. indeed. June 27. https://ca.indeed.com/career-advice/career-development/how-to-calculate-percent-difference.
Indeed Editorial Team. “Percent Difference vs. Percent Change (With Formulas).” 2024. indeed. August 17. https://ca.indeed.com/career-advice/career-development/percent-difference-vs-percent-change.
Akins, Jefferson H., and Leah M. Akins. 2025. “APPENDIX C: Writing Tips for Discussing Results.” Technical Report Writing Guidelines. Accessed January 26. https://milnepublishing.geneseo.edu/technicalreportwritingguidelines/back-matter/appendix-c-writing-tips-for-discussing-results/.
End, Nick. “How to Calculate Percent Change.” 2023. Row Zero. August 27. https://rowzero.io/blog/calculate-percent-change.
“Percent Difference – Definition, Examples, How to Calculate?” 2025. CUEMATH. Accessed January 26. https://www.cuemath.com/commercial-math/percent-difference/.
“Percentage Difference Formula – What Is Percentage Difference Formula? Examples.” 2025. CUEMATH. Accessed January 26. https://www.cuemath.com/percent-difference-formula/.
“What Is Relative Difference?” 2025. Expii. Accessed January 26. https://www.expii.com/t/what-is-relative-difference-4251.
“What Is Percentage Difference Formula?” 2024. GeeksforGeeks. GeeksforGeeks. September 2. https://www.geeksforgeeks.org/what-is-percentage-difference-formula/.
“How To Calculate Difference in Percent Changes in 5 Steps.” 2025. indeed. Accessed January 26. https://www.indeed.com/career-advice/career-development/calculate-difference.
Indeed Editorial Team. “How To Calculate the Percent Difference of 2 Values.” 2024. indeed. August 15. https://www.indeed.com/career-advice/career-development/how-to-calculate-percent-difference.
Indeed Editorial Team. “How To Calculate Percentage Difference.” 2024. indeed. October 16. https://www.indeed.com/career-advice/career-development/how-to-calculate-percentage-difference.
Kenton, Will. “How to Calculate a Percentage Change.” 2024. Investopedia. Investopedia. June 27. https://www.investopedia.com/terms/p/percentage-change.asp.
Videos
In this video, I focus on explaining percent differences intuitively. I’m going to tell you two facts. First, in 2018, you were 48% more likely to be murdered in the state of Illinois than in the state of Texas. Second, despite that, Texas had 57% more murders than the state of Illinois. Those two facts sound like they contradict each other, and yet they are both true and highly misleading. In this Data Demystified Data Bite, I’ll help you build the intuition to untangle information that uses percentages in misleading ways. I do this all without using fancy jargon or complex math. I focus on intuition and insights to help you get an intuitive understanding of complex, meaningful, and timely topics in statistics, data science, and data analytics.
The featured image on this page is from the STORY OF MATHEMATICS website.
