Contents
- General
- Probability
- Estimation
- Distributions used in hypothesis testing
- The Three Main Measures Found in Descriptive Statistics
- What Is the Difference between a t-Statistic and a z-Statistic?
- What is the difference between the normal distribution and the t distribution?
- Why scientists need to be better at data visualisation
- What is the difference between Probability Distribution Function and Cumulative Distribution Function?
- How to interpret residuals in a linear regression model
- A foray into the functions that apply to continuous distributions
- A deep dive into the functions that pertain to discrete distributions
- Inferential Statistics
- Data Analysis
- A/B Testing
- Hypothesis Testing
- Learn hypothesis testing with Python: Hypothesis tests
- Learn hypothesis testing with Python: t distribution practice problems
- Learn hypothesis testing with Python: Confidence intervals
- Learn hypothesis testing with Python: Difference in means test
- Learn hypothesis testing with Python: Normal distribution practice questions
- Learn hypothesis testing with Python: Binomial distribution practice questions
- Learn hypothesis testing with Python: Central limit theorem
- Learn hypothesis testing with Python: Probability theory
- Learn hypothesis testing with Python: Distribution theory
- Learn hypothesis testing with Python: Probability distributions
- Learn hypothesis testing with Python: Measure of association
- Learn hypothesis testing with Python: Measure of dispersion
- Learn hypothesis testing with Python: Measures of central tendency
- Distributions used in hypothesis testing
- Hypothesis testing as it relates to distributions
- How to Determine Whether to Conduct a Two Tailed or One Tailed Hypothesis Test
- What hypothesis tests can be used on the normal distribution?
- Correlation analysis as a crucial part of statistical hypothesis testing
- Regression analysis as an integral part of statistical hypothesis testing
- What is the difference between the critical z-value, z-score, and z-test statistic?
- Statistics Interview Question
- Explain statistical power?
- How does the distribution of the mean depend on distribution of data?
- What is the distribution of the sample proportion?
- What is the mean and standard deviation of the binomial distribution?
- What are the five requirements for a random variable to follow a binomial distribution?
- What is the parameter of a Poisson distribution?
- What is the difference between a binomial and a Poisson variable?
- What are measures of association?
- How do percentiles and quartiles differ?
- What is the difference between a parametric and nonparametric test?
- What is the largest number of means, medians and modes that a dataset can have?
- What is the difference between grouped and ungrouped data?
- Why is it better to report standard deviation than variance?
- What is the difference between stratified and cluster sampling?
- What is the difference between quantitative and qualitative data?
- What is a confounding variable?
- What is a t test?
- What is the difference between hypothesis testing and A/B testing?
- What is the difference between a binomial and a Poisson variable?
- Which Graphics Can Only Be Used for a Single Categorical Value?
- How Does One Determine the Tail of a Graph?
- What Are the Five Requirements of a Binomial Distribution?
- What Is the Main Purpose of a Measure of Dispersion?
- Which graphics can only be used for a single categorical value?
- What is a uniform random variable?
- What is the difference between a random discrete and random continuous variable?
- What is better, the Empirical Rule or Chebyshev’s Theorem?
- When should one use a box plot instead of a histogram?
- What is a representative sample?
- What is the difference between the binomial and hypergeometric variable?
- Give an example of a random variable that follows a normal distribution.
- Explain the rate of convergence as it relates to statistics.
- What are the three allowed signs in the null hypothesis?
- t-test
- Non-parametric Tests
- Time Series Analysis
- Visualisation
- Experimental Design
- Ethics
General
Probability
Probability is a fundamental concept in mathematics and statistics that measures the likelihood of an event occurring. It provides a way to quantify uncertainty and make informed decisions based on the available information. Probability theory is the foundation of many statistical methods and plays a crucial role in various fields, including finance, science, engineering, and social sciences.
X, Crystal. 2025. “Learn Statistics with Python: Probability.” Medium. Medium. August 6. https://tracyrenee61.medium.com/learn-statistics-with-python-probability-2b44617e58d2.
Estimation
Estimation is a central concept in the fields of probability and statistics, playing a crucial role in making inferences about population parameters based on sample data. In essence, estimation involves using sample data to infer the characteristics of a larger population.
X, Crystal. 2025. “Learn Statistics with Python: Estimation.” Medium. August 7, 2025. https://tracyrenee61.medium.com/learn-statistics-with-python-estimation-4b0f4561ba36.
Distributions used in hypothesis testing
Hypothesis testing is a fundamental aspect of inferential statistics, enabling researchers to make inferences about population parameters based on sample data. To perform hypothesis testing effectively, it is essential to understand the underlying probability distributions that govern the behaviour of data and test statistics. Several key distributions play a pivotal role in hypothesis testing to include: normal, t-distribution, chi-square, and F-distribution.
X, Crystal. 2025. “Learn Statistics with Python: Distributions Used in Hypothesis Testing.” Medium. Medium. August 7. https://tracyrenee61.medium.com/learn-statistics-with-python-distributions-used-in-hypothesis-testing-87ea3a426aba.
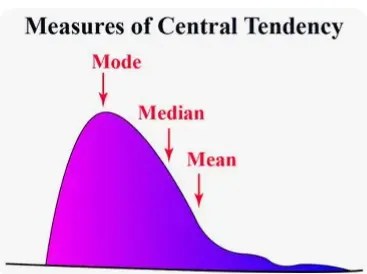
The Three Main Measures Found in Descriptive Statistics
Descriptive statics has several measures that can be used to evaluate a dataset:
1. The measure of central tendency offers insight into the typical or central value around which data points cluster.
2. The measure of variability offers insight into the spread or dispersion of the data.
3. The measure of position provides a way to understand how a specific value compares to the rest of the dataset.
X, Crystal. 2025. “The Three Main Measures Found in Descriptive Statistics.” Medium. Medium. March 12. https://tracyrenee61.medium.com/the-three-main-measures-found-in-descriptive-statistics-856b9988e343.
What Is the Difference between a t-Statistic and a z-Statistic?
The main difference between the t-statistic and the v-statistic lies in their applications and the conditions for which they are used. Both the t-statistic and z-statistic are fundamental tools in inferential statistics.
X, Crystal. 2025. “What Is the Difference between a t-Statistic and a z-Statistic?” Medium. Medium. February 3. https://tracyrenee61.medium.com/what-is-the-difference-between-a-t-statistic-and-a-z-statistic-3d1fb9a6ee14.
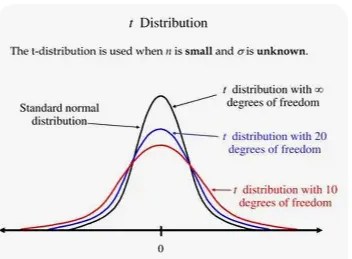
What is the difference between the normal distribution and the t distribution?
The differences between the t distribution and normal distribution are:
1. The t distribution is more appropriate for small sample sizes, whereas the normal distribution is used for large sample sizes.
2. The t distribution is used when the population standard deviation is unknown, and the normal distribution is used when the population standard deviation is known.
3. The t distribution has heavier tails, providing a more conservative estimate for small samples.
X, Crystal. 2025. “What Is the Difference between the Normal Distribution and the t Distribution?” Medium. Medium. https://tracyrenee61.medium.com/what-is-the-difference-between-the-normal-distribution-and-the-t-distribution-96af30f63c56.
Why scientists need to be better at data visualisation
The article was very good and provided me with insight into how to select graphics to put into a scientific report of presentation. The key point to take away is to use pie charts sparingly and within the proper context.
X, Crystal. 2024. “Article Review: Why Scientists Need to Be Better at Data Visualisation.” Medium. Medium. September 8. https://tracyrenee61.medium.com/article-review-why-scientists-need-to-be-better-at-data-visualisation-011388c37e7a.
What is the difference between Probability Distribution Function and Cumulative Distribution Function?
In summary, the PDF gives the probability density at a specific point, while the CDF gives the cumulative probability at that point.
X, Crystal. 2024. “What Is the Difference between Probability Distribution Function and Cumulative Distribution…” Medium. Medium. September 17. https://tracyrenee61.medium.com/what-is-the-difference-between-probability-distribution-function-and-cumulative-distribution-23cdfb69a17f.
How to interpret residuals in a linear regression model
Residuals are the differences between the observed values and the values predicted by the regression model. They represent the error or the deviation of the observed data from the model’s predictions.
X, Crystal. 2024. “How to Interpret Residuals in a Linear Regression Model.” Medium. Medium. December 21. https://tracyrenee61.medium.com/how-to-interpret-residuals-in-a-linear-regression-model-7cfd8141d456.
A foray into the functions that apply to continuous distributions
To summarise, I have covered five functions that are associated with continuous distributions. Statistics is a very in depth subject and there is much to learn before an individual can become proficient in all aspects of it, if it is at all possible.
X, Crystal. 2025. “A Foray into the Functions That Apply to Continuous Distributions.” Medium. Medium. https://tracyrenee61.medium.com/a-foray-into-the-functions-that-apply-to-continuous-distributions-001ed993e2ea.
A deep dive into the functions that pertain to discrete distributions
In conclusion, there are four functions that can be used with discrete distributions, being:
1. Probability mass function (PMF)
2. Cumulative distribution function (CDF)
3. Survival function
4. Hazard function
Of course, it will take quite a bit of practice to become proficient in these functions and how they relate to the various discrete distributions.
X, Crystal. 2025. “A Deep Dive into the Functions That Pertain to Discrete Distributions.” Medium. Medium. https://tracyrenee61.medium.com/a-deep-dive-into-the-functions-that-pertain-to-discrete-distributions-20f85546277d.
Inferential Statistics
Learn statistics with Python: Inferential statistics
Inferential statistics is a branch of statistics that focuses on making predictions or inferences about a population based on a sample of data. Unlike descriptive statistics, which merely summarize data, inferential statistics go a step further by using data to make generalizations, draw conclusions, and test hypotheses.
X, Crystal. 2025. “Learn Statistics with Python: Inferential Statistics.” Medium. August 6, 2025. https://tracyrenee61.medium.com/learn-statistics-with-python-inferential-statistics-d5732625de20.
Data Analysis
Learn statistics with Python: Correlation and regression analysis
Statistical correlation and regression analysis are fundamental techniques in data analysis, enabling researchers and analysts to explore relationships between variables. Both methods provide valuable insights into how variables are connected and allow us to make informed predictions. While correlation measures the strength and direction of a relationship, regression goes further to describe the functional dependence between variables.
X, Crystal. 2025. “Learn Statistics with Python: Correlation and Regression Analysis.” Medium. Medium. August 8. https://tracyrenee61.medium.com/learn-statistics-with-python-correlation-and-regression-analysis-4d7ee4a9cb66.
A/B Testing
A/B Testing as an Essential Decision Making Tool in Statistics
In today’s data-driven world, A/B testing has become a cornerstone of experimentation and optimization. By empowering organizations to test hypotheses, validate ideas, and improve outcomes systematically, it minimizes uncertainty and drives innovation. Whether optimizing a website, enhancing marketing campaigns, or refining product features, A/B testing serves as a critical bridge between intuition and evidence, enabling informed decision-making in an ever-changing landscape.
X, Crystal. 2025. “A/B Testing as an Essential Decision Making Tool in Statistics.” Medium. Medium. March 19. https://tracyrenee61.medium.com/a-b-testing-as-an-essential-decision-making-tool-in-statistics-f123152a2776.
Learn statistics with Python: A/B testing
A/B testing, also known as split testing, is a statistical method used to compare two versions of a variable to determine which one performs better. Widely employed in fields like marketing, product design, and website optimization, A/B testing empowers organizations to make data-driven decisions.
X, Crystal. 2025. “Learn Statistics with Python: A/B Testing.” Medium. Medium. August 10. https://tracyrenee61.medium.com/learn-statistics-with-python-a-b-testing-9259037cacc4.
Hypothesis Testing
Learn hypothesis testing with Python: Hypothesis tests
Hypothesis testing is a fundamental statistical tool that allows researchers to make inferences about population parameters based on sample data. It provides a structured methodology for determining whether there is enough evidence to support a specific hypothesis.
X, Crystal. 2025. “Learn Hypothesis Testing with Python: Hypothesis Tests.” Medium. August 28, 2025. https://tracyrenee61.medium.com/learn-hypothesis-testing-with-python-hypothesis-tests-3af342f1f03f.
Learn hypothesis testing with Python: t distribution practice problems
t-distribution is a continuous probability distribution used when estimating the mean of a population where the sample size is small and/or the population variance is unknown. It is similar in shape to the normal distribution but has heavier tails.
X, Crystal. 2025. “Learn Hypothesis Testing with Python: T Distribution Practice Problems.” Medium. August 27, 2025. https://tracyrenee61.medium.com/learn-hypothesis-testing-with-python-t-distribution-practice-problems-0d9ecbb85aaa.
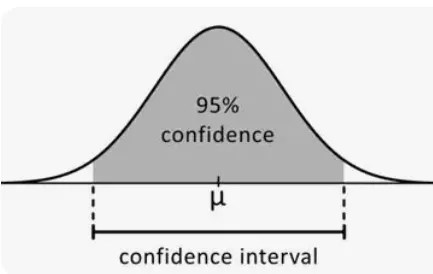
Learn hypothesis testing with Python: Confidence intervals
In the world of statistics, the concept of confidence intervals (CIs) serves as a fundamental tool for making inferences about a population based on sample data. Confidence intervals provide a range of values within which we can be reasonably certain that a population parameter, such as a mean or proportion, lies.
X, Crystal. 2025. “Learn Hypothesis Testing with Python: Confidence Intervals.” Medium. August 28, 2025. https://tracyrenee61.medium.com/learn-hypothesis-testing-with-python-confidence-intervals-7b1f2bf1afaa.
Learn hypothesis testing with Python: Difference in means test
Statistical difference in means tests, commonly referred to as hypothesis tests for means, are powerful tools used by researchers to determine whether there is a significant difference between the means of two or more groups. These tests are fundamental in various fields, including healthcare, social sciences, economics, and engineering.
X, Crystal. 2025. “Learn Hypothesis Testing with Python: Difference in Means Test.” Medium. August 29, 2025. https://tracyrenee61.medium.com/learn-hypothesis-testing-with-python-difference-in-means-test-33cd53e9abd3.
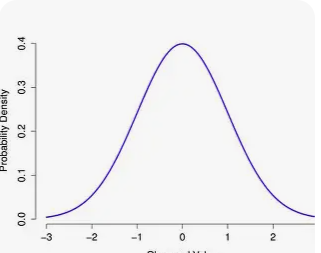
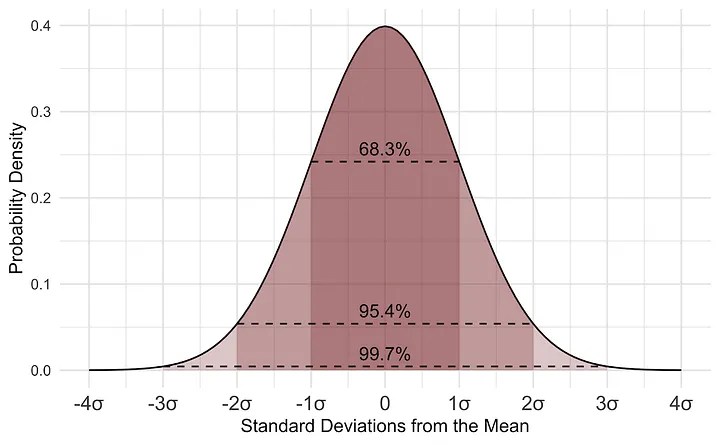
Learn hypothesis testing with Python: Normal distribution practice questions
The normal distribution is a continuous probability distribution characterized by a bell-shaped curve. It is symmetric around the mean, where most values cluster near the centre and taper off toward the extremes.
X, Crystal. 2025. “Learn hypothesis testing with Python: Normal distribution practice questions.” Medium. August 26, 2025. https://tracyrenee61.medium.com/learn-hypothesis-testing-with-python-normal-distribution-practice-questions-08ae8d6b96f3.
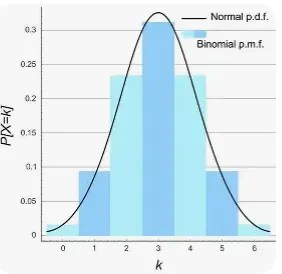
Learn hypothesis testing with Python: Binomial distribution practice questions
The binomial distribution is a discrete probability distribution that models the number of successes in a fixed number of independent trials, each with the same probability of success.
X, Crystal. 2025. “Learn Hypothesis Testing with Python: Binomial Distribution Practice Questions.” Medium. August 27, 2025. https://tracyrenee61.medium.com/learn-hypothesis-testing-with-python-binomial-distribution-practice-questions-a35d6bc07f71.
Learn hypothesis testing with Python: Central limit theorem
The Central Limit Theorem (CLT) is one of the most fundamental principles in probability and statistics. It underpins a wide array of statistical methods and provides the theoretical foundation for many aspects of modern data analysis. Despite its technical nature, the theorem offers a remarkably simple yet profound insight: the average of a large number of independent, identically distributed random variables tends to follow a normal distribution, regardless of the shape of the original population distribution.
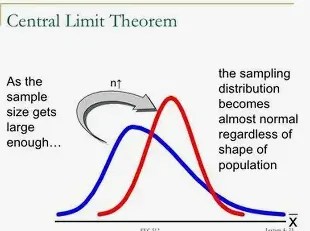
X, Crystal. 2025. “Learn Hypothesis Testing with Python: Central Limit Theorem.” Medium. August 26, 2025. https://tracyrenee61.medium.com/learn-hypothesis-testing-with-python-central-limit-theorem-d198525cf4c0.
Learn hypothesis testing with Python: Probability theory
Probability theory is a branch of mathematics that studies the likelihood of events occurring. It provides a framework for analysing randomness, uncertainty, and patterns in seemingly unpredictable phenomena. From predicting the weather to guiding financial decisions, probability theory serves as the backbone of statistics, data science, and numerous real-world applications.

X, Crystal. 2025. “Learn Hypothesis Testing with Python: Probability Theory.” Medium. August 25, 2025. https://tracyrenee61.medium.com/learn-hypothesis-testing-with-python-probability-theory-b643b1114033.
Learn hypothesis testing with Python: Distribution theory
Distribution theory is a cornerstone of probability and statistics that deals with how values in a dataset are distributed. In practical terms, it examines how the frequency of data points aligns with specific patterns or shapes. Understanding the shape of a data distribution helps in interpreting statistical results and making informed decisions.

X, Crystal. 2025. “Learn Hypothesis Testing with Python: Distribution Theory.” Medium. August 25, 2025. https://tracyrenee61.medium.com/learn-hypothesis-testing-with-python-distribution-theory-dde6b3be940e.
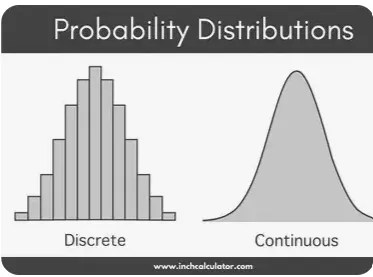
Learn hypothesis testing with Python: Probability distributions
Probability distributions describe how the values of a random variable are distributed. They provide a mathematical function that specifies the likelihood of each possible outcome in an experiment. Probability distributions can be categorized as discrete (e.g., Binomial, Poisson) or continuous (e.g., Normal, t-distribution), depending on whether the random variable takes on discrete or continuous values.
X, Crystal. 2025. “Learn Hypothesis Testing with Python: Probability Distributions.” Medium. August 25, 2025. https://tracyrenee61.medium.com/learn-hypothesis-testing-with-python-probability-distributions-e903bab3fe5f.
Learn hypothesis testing with Python: Measure of association
The measure of association refers to statistical techniques used to quantify the strength and direction of the relationship between two variables. It is a foundational concept in statistics, helping to determine whether and how strongly variables are related. This measure is widely used in fields like sociology, economics, biology, and more.
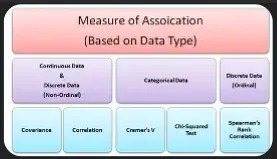
X, Crystal. 2025. “Learn Hypothesis Testing with Python: Measure of Association.” Medium. August 24, 2025. https://tracyrenee61.medium.com/learn-hypothesis-testing-with-python-measure-of-association-7465e65b4352.
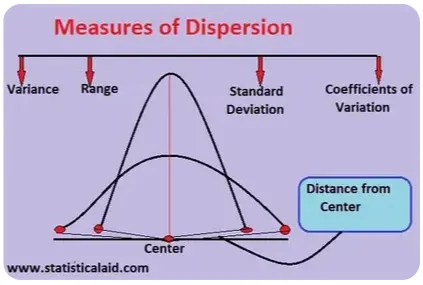
Learn hypothesis testing with Python: Measure of dispersion
The measure of dispersion is a statistical concept that quantifies the spread, variability, or distribution of a dataset. It provides insight into how much the values in a dataset differ from each other or from a central value (like the mean or median). Measures of dispersion complement measures of central tendency (like mean, median, and mode), offering a more complete picture of the dataset.
X, Crystal. 2025. “Learn Hypothesis Testing with Python: Measure of Dispersion.” Medium. August 24, 2025. https://tracyrenee61.medium.com/learn-hypothesis-testing-with-python-measure-of-dispersion-db4446d42348.
Learn hypothesis testing with Python: Measures of central tendency
The measure of central tendency refers to statistical metrics that represent the centre or typical value of a dataset. It gives a summary of where most data points in a distribution cluster. The three most common measures of central tendency are mean, median, and mode. Each has unique characteristics and is suited for different types of analysis.
X, Crystal. 2025. “Learn Hypothesis Testing with Python: Measures of Central Tendency.” Medium. August 24, 2025. https://tracyrenee61.medium.com/learn-hypothesis-testing-with-python-measures-of-central-tendency-d417ba471384.
Distributions used in hypothesis testing
Hypothesis testing is a fundamental aspect of inferential statistics, enabling researchers to make inferences about population parameters based on sample data. To perform hypothesis testing effectively, it is essential to understand the underlying probability distributions that govern the behaviour of data and test statistics. Several key distributions play a pivotal role in hypothesis testing to include: normal, t-distribution, chi-square, and F-distribution.
X, Crystal. 2025. “Learn Statistics with Python: Distributions Used in Hypothesis Testing.” Medium. Medium. August 7. https://tracyrenee61.medium.com/learn-statistics-with-python-distributions-used-in-hypothesis-testing-87ea3a426aba.
Hypothesis testing as it relates to distributions
Hypothesis testing is a cornerstone of inferential statistics, enabling researchers to draw conclusions about a population based on sample data. At its core, hypothesis testing involves making a claim (hypothesis) about a population parameter and using statistical techniques to determine whether the evidence supports or contradicts that claim. The process relies heavily on probability distributions, which serve as the foundation for calculating test statistics, critical values, and p-values.
X, Crystal. 2025. “Learn Statistics with Python: Hypothesis Testing as It Relates to Distributions.” Medium. Medium. August 8. https://tracyrenee61.medium.com/learn-statisticsc-with-python-hypothesis-testing-as-it-relates-to-distributions-338fa804cc4d.
How to Determine Whether to Conduct a Two Tailed or One Tailed Hypothesis Test
The key points to keep in mind when selecting the most appropriate hypothesis test to perform are:
1. For a two tailed test, check for any significant difference between the sample and population.
2. For a one tailed right test, check for a significant increase in the sample mean.
3. For a one tailed left test, check for a significant decrease in the sample mean.
X, Crystal. 2025. “How to Determine Whether to Conduct a Two Tailed or One Tailed Hypothesis Test.” Medium. Medium. https://tracyrenee61.medium.com/how-to-determine-whether-to-conduct-a-two-tailed-or-one-tailed-hypothesis-test-f173f614f401.
What hypothesis tests can be used on the normal distribution?
In this blog post I discussed the normal distribution, hypothesis testing, and five hypothesis tests that can be carried out to analyse data.
X, Crystal. 2025. “What Hypothesis Tests Can Be Used on the Normal Distribution?” Medium. Medium. https://tracyrenee61.medium.com/what-hypothesis-tests-can-be-used-on-the-normal-distribution-2737e2cd6bec.
Correlation analysis as a crucial part of statistical hypothesis testing
In this post I have illustrated three methods of performing a correlation analysis:
1. Pearson’s correlation can be used for normally distributed data.
2. Spearman’s rank correlation can be used when the data is not normally distributed or when the relationship between the variables is monotonic but not necessarily linear.
3. Kendall’s tau correlation can be used when the distribution is not normal, the sample sizes are small, or the data has tied ranks.
X, Crystal. 2024. “Correlation Analysis as a Crucial Part of Statistical Hypothesis Testing.” Medium. Medium. November 25. https://tracyrenee61.medium.com/correlation-analysis-as-a-crucial-part-of-statistical-hypothesis-testing-db09aeb6d61f.
Regression analysis as an integral part of statistical hypothesis testing
It is very interesting indeed that regression analysis initially appeared in statistical hypothesis testing and then made its way to machine learning.
X, Crystal. 2024. “Regression Analysis as an Integral Part of Statistical Hypothesis Testing.” Medium. Medium. November 24. https://tracyrenee61.medium.com/regression-analysis-as-an-integral-part-of-statistical-hypothesis-testing-cf839edf287a.
What is the difference between the critical z-value, z-score, and z-test statistic?
When studying inferential statistics, it is important to be familiar with the normal distribution, which is also called a z distribution by some. The z-score and z-value are derived from the normal distribution.
X, Crystal. 2025. “What Is the Difference between the Critical Z-Value, Z-Score, and Z-Test Statistic?” Medium. September 14, 2025. https://tracyrenee61.medium.com/what-is-the-difference-between-the-critical-z-value-z-score-and-z-test-statistic-8b1f9ae042a3.
Statistics Interview Question
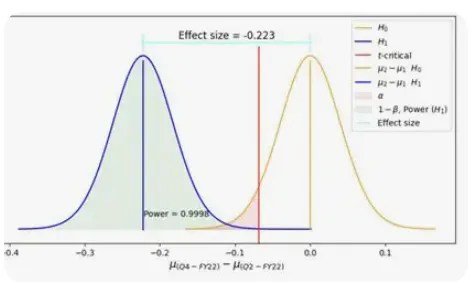
Explain statistical power?
Statistical power is the probability that a statistical test will correctly detect an effect when the effect truly exists. It is a measure of how well a test can avoid making a false negative error (type II error), where the test fails to find a real effect. Statistical tests aim to determine if there is enough evidence to reject a null hypothesis, which usually states there is no effect or no difference.
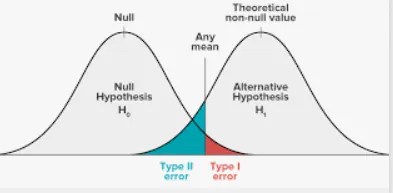
X, Crystal. 2025. “Statistical Interview Question: Explain Statistical Power.” Medium. August 26, 2025. https://tracyrenee61.medium.com/statistical-interview-question-explain-statistical-power-07717b61bd95.
How does the distribution of the mean depend on distribution of data?
The mean of a distribution is the average of all of the elements of that distribution, from the smallest value to the largest. The mean of a distribution differs from the median, which is the centre of that distribution.
X, Crystal. 2025. “Statistics Interview Question: How Does the Distribution of the Mean Depend on Distribution of Data?” Medium. Medium. August 12. https://tracyrenee61.medium.com/statistics-interview-question-how-does-the-distribution-of-the-mean-depend-on-distribution-of-data-5b74cb786850.
What is the distribution of the sample proportion?
A sample proportion is the proportion of a specific characteristic found within a sample taken from a larger population. It is a way to estimate the proportion of a characteristic within an entire population, especially when measuring the whole population is impractical. A sample proportion (p-hat) is calculated by dividing the number of items in a sample that have a certain characteristic by the total number of items in that sample.
Sample proportions are used as estimates for the population proportion, which is the proportion of the characteristic for the entire population. Since it is often impossible to survey every individual in a population, samples are used to make inferences about populations based on smaller, manageable samples.
In statistics, the sample proportion, denoted as “p-hat” (p̂), represents the proportion of a sample that exhibits a specific characteristic or outcome. It’s calculated by dividing the number of “successes” (or occurrences of the characteristic of interest) in the sample by the total sample size.
X, Crystal. 2025. “Statistics Interview Question: What Is the Distribution of the Sample Proportion.” Medium. Medium. August 18. https://tracyrenee61.medium.com/statistics-interview-question-what-is-the-distribution-of-the-sample-proportion-110c7f3fe062.
What is the mean and standard deviation of the binomial distribution?
The binomial distribution describes the probability of obtaining k successes in n binomial experiments. It evaluates the probability for an outcome to either succeed or fail. It is a mutually exclusive outcome, where the analyst can have one or the other, but not both at the same time.
X, Crystal. 2025. “Statistics Interview Question: What Is the Mean and Standard Deviation of the Binomial Distribution?” Medium. Medium. June 24. https://tracyrenee61.medium.com/statistics-interview-question-what-is-the-mean-and-standard-deviation-of-the-binomial-distribution-97ba235f5094.
What are the five requirements for a random variable to follow a binomial distribution?
The five requirements for a random variable to follow a binomial distribution are:
1. There are only two possible outcomes, success or failure.
2. The experiment is repeated a specific number of times.
3. The outcome of one trial does not affect the outcome of other trials.
4. The probability of success is the same for each trial.
5. The trials are conducted randomly.
X, Crystal. 2024. “Statistics Interview Question: What Are the Five Requirements for a Random Variable to Follow a…” Medium. Medium. December 17. https://tracyrenee61.medium.com/statistics-interview-question-what-are-the-five-requirements-for-a-random-variable-to-follow-a-147f3e26dae4.
What is the parameter of a Poisson distribution?
To answer the statistics interview question, the parameter of a Poisson distribution is lambda (λ), which is the mean number of events that occur within a given interval of time or space.
X, Crystal. 2024. “Statistics Interview Question: What Is the Parameter of a Poisson Distribution?” Medium. Medium. November 7. https://tracyrenee61.medium.com/statistics-interview-question-what-is-the-parameter-of-a-poisson-distribution-8cc17b809021.
What is the difference between a binomial and a Poisson variable?
The main difference between the binomial and Poisson variables are the number of trials, the probability of success, and the nature of the experiment. Binomial distribution describes the distribution of binary data from a finite sample. It gives the probability of getting r events out of N trials. The Poisson distribution describes the distribution of binary data from an infinite sample. It gives the probability of getting r events in a population.
X, Crystal. 2024. “Statistics Interview Question: What Is the Difference between a Binomial and a Poisson Variable?” Medium. Medium. December 2. https://tracyrenee61.medium.com/statistics-interview-question-what-is-the-difference-between-a-binomial-and-a-poisson-variable-92411878ba8b.
What are measures of association?
In summary, measures of association are tests that measure how one variable is correlated to another. There are a number of tests that can be performed to calculate the measure of association between two variables and I have named a few of the most popular ones in this post.
X, Crystal. 2025. “Statistics Interview Question: What Are Measures of Association?” Medium. Medium. March 10. https://tracyrenee61.medium.com/statistics-interview-question-what-are-descriptive-measures-of-association-23ee9c7612b5.
How do percentiles and quartiles differ?
To answer the question, the main difference between the quartile and the percentile is that the quartile divides the set of data into four equal parts while the percentile divides the data into 100 equal parts.
X, Crystal. 2024. “Statistics Interview Question: How Do Percentiles and Quartiles Differ?” Medium. Medium. October 22. https://tracyrenee61.medium.com/statistics-interview-question-how-do-percentiles-and-quartiles-differ-f6033394ddab.
What is the difference between a parametric and nonparametric test?
Some parametric tests are, which assume that the data follows a certain distribution, usually being normal, and have specific requirements about data parameters.
Nonparametric tests are used for hypothesis testing without making assumptions about the underlying distribution of data. Nonparametric tests don’t require the analyst to follow a specific distribution, which is usually a normal distribution, because they are not based on a particular distribution.
It is important to select the hypothesis test carefully because, in my experience, they all give varying results.
X, Crystal. 2024. “Statistical Interview Question: What Is the Difference between a Parametric and Nonparametric Test?” Medium. Medium. October 27. https://tracyrenee61.medium.com/statistical-interview-question-what-is-the-difference-between-a-parametric-and-nonparametric-test-e81167e9b340.
What is the largest number of means, medians and modes that a dataset can have?
In summary, the measure of central tendency can be calculated in both the Python programming language and also Excel. In my humble opinion:
1. The mean can have only one value because all of the elements of the dataset are added and then divided by the number of elements in the dataset.
2. The median can have only one value because the values in the dataset are sorted. If the dataset has an odd number of elements then the central value is selected. If an even number of elements are in the dataset then the two central elements are selected and averaged, thereby producing one result.
3. The mode is representative of the maximum number of one particular value in a dataset. In theory, if each element in a dataset is composed of only one value, the mode could be the number of elements in the dataset.
X, Crystal. 2024. “Statistics Interview Question: What Is the Largest Number of Means, Medians and Modes That a…” Medium. Medium. September 30. https://tracyrenee61.medium.com/statistics-interview-question-what-is-the-largest-number-of-means-medians-and-modes-that-a-b36084a79483.
What is the difference between grouped and ungrouped data?
Grouped data is a type of data that has been organised into specific groups or categories, sometimes known as tabulated data. It is a way to present raw data in a more meaningful and manageable way. Grouped data is typically used for statistical analysis because it allows for easier comparison and interpretation of data.
X, Crystal. 2024. “Statistics Interview Question: What Is the Difference between Grouped and Ungrouped Data?” Medium. Medium. July 16. https://tracyrenee61.medium.com/statistics-interview-question-what-is-the-difference-between-grouped-and-ungrouped-data-dbffab234757.
Why is it better to report standard deviation than variance?
Standard deviation is often preferred over variance because it is easier to understand and interpret for the following reasons:
1. Standard deviation is expressed in the same units of data.
2. Standard deviation is intuitive, being a direct measure of how far away each data point is from the mean, making it easier to understand the variability in a dataset.
3. Standard deviation is essential in descriptive statistics and it is used to visualise the effect size when comparing two groups of data.
Variance is the average of squared distances from the mean and is expressed in squared units, making it more difficult to intuitively interpret. Variance is still nevertheless an important measurement and it used as the main measurements as the main hypothesis test, such as chi-square test, f-ratio test and z-test.
X, Crystal. 2024. “Statistics Interview Question: Why Is It Better to Report Standard Deviation than Variance?” Medium. Medium. October 9. https://tracyrenee61.medium.com/statistics-interview-question-why-is-it-better-to-report-standard-deviation-than-variance-c2c2259d5f24.
What is the difference between stratified and cluster sampling?
What is the difference between stratified and cluster sampling?
Cluster sampling begins by dividing a population into groups that often have a shared geographical location before choosing members of random groups.
Stratified sampling divides a population into specific groups relating to an interest and includes and includes some members of all of the groups.
Stratified sampling tends to be more accurate than cluster sampling because the researcher tends to select specific categories to align with the needs of the study.
Cluster sampling tends to be more efficient than stratified sampling because entire clusters that are naturally divided are selected.
X, Crystal. 2024. “Statistics Interview Question: What Is the Difference between Stratified and Cluster Sampling?” Medium. Medium. July 2. https://tracyrenee61.medium.com/statistics-interview-question-what-is-the-difference-between-stratified-and-cluster-sampling-0961eaa8a02f.
What is the difference between quantitative and qualitative data?
There are two types of data in statistics, being quantitative (numeric) and qualitative (categorical). The qualitative data must first be converted to numeric form before they can be trained in a machine learning model.
X, Crystal. 2024. “Statistics Interview Question: What Is the Difference between Quantitative and Qualitative Data?” Medium. Medium. June 17. https://tracyrenee61.medium.com/statistics-interview-question-what-is-the-difference-between-quantitative-and-qualitative-data-57ef50962ce9.
What is a confounding variable?
In statistics, a confounding variable is an unmeasured third variable that influences both the independent and dependent variables. For example, in a scenario with three variables, X is the independent variable, y is the dependent variable, and Z is potentially the confounding variable.
A confounding variable cannot occur when there are only two variables in a dataset, as this is a phenomenon that can only occur with three or more variables.
X, Crystal. 2024. “Statistics Interview Question: What Is a Confounding Variable?” Medium. Medium. July 3. https://tracyrenee61.medium.com/statistics-interview-question-what-is-a-confounding-variable-1709537aed09.
What is a t test?
I have demonstrated three ways that a t-test can be performed, using:
1. Numpy,
2. Scipy, or
3., Statsmodels.
I have also gone into detail about the t-statistic and p-value, which are derived when a t-test is performed.
Therefore, the student of data science should have enough information to smash an interview question concerning, t-tests, t-statistics, p-values, and hypothesis testing.
X, Crystal. 2024. “Interview Question: What Is a t Test?” Medium. Medium. April 17. https://tracyrenee61.medium.com/interview-question-what-is-a-t-test-c34261aa7a99.
What is the difference between hypothesis testing and A/B testing?
I think that statistics is a fascinating subject that allows analysts to perform a variety of statistical tests based on the data they have on hand, thereby helping them to come to the best conclusions. A/B testing is just one of a number of types of statistical testing mechanisms that can be used in the context of using a scientific basis to solve problems.
X, Crystal. 2024. “Statistics Interview Question: What Is the Difference between Hypothesis Testing and A/B Testing?” Medium. Medium. November 24. https://tracyrenee61.medium.com/statistics-interview-question-what-is-the-difference-between-hypothesis-testing-and-a-b-testing-7608a099d439.
What is the difference between a binomial and a Poisson variable?
A binomial variable is used to describe the probability of a specific number of successes in a fixed number of trials. The Poisson variable, on the other hand, is a variable used to describe the probability of a certain number of events in a given interval of time.
X, Crystal. 2025. “Statistics Interview Question: What Is the Difference between a Binomial and a Poisson Variable?” Medium. Medium. https://tracyrenee61.medium.com/statistics-interview-question-what-is-the-difference-between-a-binomial-and-a-poisson-variable-cf2f66f231dd.
Which Graphics Can Only Be Used for a Single Categorical Value?
It is important to visualize data because this method of presentation is easier for non-technical people to read and understand.
X, Crystal. 2024. “Statistics Interview Question: Which Graphics Can Only Be Used for a Single Categorical Value?” Medium. Medium. August 20. https://tracyrenee61.medium.com/statistics-interview-question-which-graphics-can-only-be-used-for-a-single-categorical-value-287529968325.
How Does One Determine the Tail of a Graph?
One question that may arise in an interview is how does one determine the tail of a graphic? The answer to this question is that there are three types of tails in a graph, being right skewed, left skewed, and symmetric.
X, Crystal. 2024. “Statistics Interview Question: How Does One Determine the Tail of a Graph?” Medium. Medium. September 23. https://tracyrenee61.medium.com/statistics-interview-question-how-does-one-determine-the-tail-of-a-graph-e3cf140bf886.
What Are the Five Requirements of a Binomial Distribution?
There are five requirements that need to be satisfied before a binomial distribution can be created, being:
1. The number of trials, represented by n, is fixed and cannot be changed during the analysis.
2. There are only two possible outcomes for each trial, being success or failure.
3. The outcome of each trial is independent of all other trials.
4. The probability of success, represented by p, is constant and remains the same for each trial.
5. The trials are conducted randomly.
X, Crystal. 2024. “Statistics Interview Question: What Are the Five Requirements of a Binomial Distribution?” Medium. Medium. November 7. https://tracyrenee61.medium.com/statistics-interview-question-what-are-the-five-requirements-of-a-binomial-distribution-659943fd7d7d.
What Is the Main Purpose of a Measure of Dispersion?
Dispersion is a very important metric that is used widely in statistical testing. The main purpose of the measure of dispersion is to indicate the degree of spread of data in a dataset.
X, Crystal. 2024. “Statistics Interview Question: What Is the Main Purpose of a Measure of Dispersion?” Medium. Medium. October 3. https://tracyrenee61.medium.com/statistics-interview-question-what-is-the-main-purpose-of-a-measure-of-dispersion-e6f7ab0ba870.
Which graphics can only be used for a single categorical value?
I have shown above the two types of graphs that can be used to visualise a single categorical value. It is important to visualise data because this method of presentation is easier for non-technical people to read and understand.
X, Crystal. 2024. “Statistics Interview Question: Which Graphics Can Only Be Used for a Single Categorical Value?” Medium. Medium. August 20. https://tracyrenee61.medium.com/statistics-interview-question-which-graphics-can-only-be-used-for-a-single-categorical-value-287529968325.
What is a uniform random variable?
Uniform random variables are often used in simulations and various applications where equal probability of outcomes is assumed.
Uniform random variables can be used in real world applications where equal probability of outcomes are assumes, such as:
1. Random number generation for simulations and algorithms
2. Gaming and gambling
3. Quality control in manufacturing processes
4. Cryptography
5. Randomised algorithms in computer science
X, Crystal. 2025. “Statistics Interview Question: What Is a Uniform Random Variable?” Medium. Medium. https://tracyrenee61.medium.com/statistics-interview-question-what-is-a-uniform-random-variable-f507048a1a48.
What is the difference between a random discrete and random continuous variable?
A variable in statistics is a characteristic, number or quantity that can be measured or counted. Variables are essential components of statistical data and can be used to describe a population or sample.
The two types of variables discussed in this blog post are discrete and continuous:-
A discrete variable is a numeric variable that can take on certain values, such as the number of heads when flipping coins.
1. A continuous variable can take on any value within a given range, such as height, weight, or temperature.
2. A discrete random variable can have a finite number of possible values, while a continuous random variable can have an infinite number of possible values.
X, Crystal. 2025. “Statistics Interview Question: What Is the Difference between a Random Discrete and Random…” Medium. Medium. https://tracyrenee61.medium.com/statistics-interview-question-what-is-the-difference-between-a-random-discrete-and-random-3f6bd731396f.
What is better, the Empirical Rule or Chebyshev’s Theorem?
I believe that Chebyshev’s Theorem is a better rule to follow because it can be applied to any distribution, while the Empirical Rule can only be applied to normal distributions.
X, Crystal. 2024. “Statistics Interview Question: What Is Better, the Empirical Rule or Chebyshev’s Theorem?” Medium. Medium. October 17. https://tracyrenee61.medium.com/statistics-interview-question-what-is-better-the-empirical-rule-or-chebyshevs-theorem-b431c6be349f.
When should one use a box plot instead of a histogram?
A boxplot is a better choice than a histogram when the analyst wants to compare multiple groups or distributions, or when there is a small sample size. Boxplots are not good at showing the average response or the spread of data, and they don’t show as much detail as histograms.
X, Crystal. 2024. “Statistics Interview Question: When Should One Use a Box Plot Instead of a Histogram?” Medium. Medium. November 7. https://tracyrenee61.medium.com/statistics-interview-question-when-should-one-use-a-box-plot-instead-of-a-histogram-9653ac75d239.
What is a representative sample?
A representative sample is a subset of a population that seeks to accurately reflect the characteristics of the larger group. For example, a population of 30 people, composed of 15 males and 15 females, could generate a representative sample of 6 individuals, composed of 3 males and 3 females.
A representative sample seeks to choose components that match with key characteristics in the entire population being examined. Representative samples yield the best results, but they can also be very difficult to obtain.
Representative sampling used the stratified sampling method to help identify its components. I have discussed other sampling techniques of random, systematic, and clustering in a recent blog post, which can be read here: https://medium.com/@tracyrenee61/interview-question-what-are-the-four-types-of-probability-sampling-d0050ce56ea1.
X, Crystal. 2024. “Statistics Interview Question: What Is a Representative Sample?” Medium. Medium. June 25. https://tracyrenee61.medium.com/statistics-interview-question-what-is-a-representative-sample-b947fd4bd8bf.
What is the difference between the binomial and hypergeometric variable?
The main difference between the binomial and hypergeometric variable is how the trials are conducted:
1. In the binomial variable, trials are independent, meaning the probability of success is the same for each trial.
2. In the hypergeometric variable, the trials are not independent, meaning the probability of success changes for each trial because objects are selected without replacement.
Both distributions describe the number of times an event occurs in a fixed number of trials. The binomial distribution is used when the population is large enough that the outcome of a trial has little effect on the probability of the next outcome. The hypergeometric distribution is used when the population is small enough that the outcome of a trial has a large effect on the probability of the next outcome.
X, Crystal. 2024. “Statistics Interview Question: What Is the Difference between the Binomial and Hypergeometric…” Medium. Medium. December 24. https://tracyrenee61.medium.com/statistics-interview-question-what-is-the-difference-between-the-binomial-and-hypergeometric-88f0e8362944.
Give an example of a random variable that follows a normal distribution.
The normal distribution, often called the Gaussian distribution, is widely considered the most common distribution in statistics and many other fields. It is frequently used to model real world data and is essential for many statistical procedures.
X, Crystal. 2025. “Statistical Interview Question: Give an Example of a Random Variable That Follows a Normal…” Medium. Medium. April 17. https://tracyrenee61.medium.com/statistical-interview-question-give-an-example-of-a-random-variable-that-follows-a-normal-058696d8bcbf.
Explain the rate of convergence as it relates to statistics.
The central limit theorem (CLT) states that a population with mean (mu) and standard deviation (sigma) and taking samples of the population with replacement, the distribution of the sample means will be approximately normally distributed.
The three rules of the central limit theorem are:
1. The sample must be random,
2. The samples should be unrelated to each other, and
3. One sample should not impact the others.
Convergence refers to the tendency of a sequence of values, such as means or proportions, to approach a specific target or limiting values as the size increases. It is a fundamental concept in probability theory and statistics, particularly in the context of the CLT.
X, Crystal. 2025. “Statistical Interview Question: Explain the Rate of Convergence as It Relates to Statistics.” Medium. July 22, 2025. https://tracyrenee61.medium.com/statistical-interview-question-explain-the-rate-of-convergence-as-it-relates-to-statistics-eecd3a19c694.
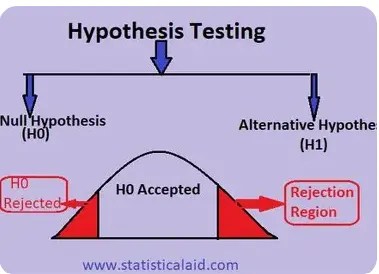
What are the three allowed signs in the null hypothesis?
In the field of statistics, the null hypothesis (H0) is the default statistical assumption that there is no significant effect, difference, or relationship between variables in a population, acting like a starting point in research that the researcher tries to disprove. In a hypothesis test, if there is a low p-value, the researcher can reject the null hypothesis and support the alternative hypothesis (Ha). If the p-value is above the significance level, or alpha, the researcher can fail to reject the null hypothesis. The default position of the null hypothesis is that the statement has no change or no relationship. The goal of performing a hypothesis test is to see if sample data provides enough to reject the null hypothesis in favour of the alternative hypothesis. In a nutshell, the null hypothesis (H0) indicates there is no significant difference between two samples, while the alternate hypothesis (Ha) indicates there is a significant difference between the two samples. The null hypothesis must always contain a form of equality because hypothesis testing is based on the assumption that the null is true until proven otherwise.
X, Crystal. “Statistics Interview Question: What Are the Three Allowed Signs in the Null Hypothesis?” Medium, January 26, 2026. https://tracyrenee61.medium.com/statistics-interview-question-what-are-the-three-allowed-signs-in-the-null-hypothesis-4233e40181d9.
t-test
What Is the Difference between a Paired Sample t-Test and a Two Sample t-Test
Using the correct test on the data’s nature is crucial to ensure accurate and meaningful results. It is important to keep in mind whether data is independent or is composed of paired observations before choosing the most appropriate statistical test to undertake.
X, Crystal. 2025. “What Is the Difference between a Paired Sample T-Test and a Two Sample t-Test.” Medium. Medium. February 6. https://tracyrenee61.medium.com/what-is-the-difference-between-a-paired-sample-t-test-and-a-two-sample-t-test-4153d009cf3a.
Why do data scientists use the t distribution when population variance is unknown?
I have been studying statistics for a few years now and one thing that I learned early on is that the t distribution and z distribution (normal distribution) are very similar. The only main difference is that the t distribution has heavier tails than the normal distribution.
X, Crystal. 2025. “Why Do Data Scientists Use the T Distribution When Population Variance Is Unknown?” Medium. October 28, 2025. https://tracyrenee61.medium.com/why-do-data-scientists-use-the-t-distribution-when-population-variance-is-unknown-06ad4d2e26db.
Non-parametric Tests
Learn statistics with Python: Non-parametric tests
Statistical analysis is a cornerstone of modern data interpretation, offering tools to explore, describe, and infer conclusions about populations. Among these tools are non-parametric tests, which have carved out a vital space in statistical methods. Unlike their parametric counterparts, non-parametric tests do not assume an underlying distribution for the data. This flexibility makes them indispensable in certain scenarios, particularly when the data are not normally distributed, sample sizes are small, or data types are ordinal or categorical.
X, Crystal. 2025. “Learn Statistics with Python: Non-Parametric Tests.” Medium. Medium. August 9. https://tracyrenee61.medium.com/learn-statistics-with-python-non-parametric-tests-73116b504590.
Time Series Analysis
Time Series Analysis in Statistics
Time series analysis is a powerful statistical tool for understanding and forecasting temporal data. By leveraging its methods, researchers and practitioners gain critical insights into patterns and relationships that would otherwise remain hidden. Despite its challenges, advancements in statistical and computational techniques continue to enhance this science’s effectiveness and scope, cementing its importance in statistics and beyond.
X, Crystal. 2025. “Time Series Analysis in Statistics.” Medium. Medium. March 19. https://tracyrenee61.medium.com/time-series-analysis-in-statistics-5a85eaf5a9a9.
Learn statistics with Python: Time Series Analysis in Statistics
Time series analysis is a specialized branch of statistics used to analyse datasets where observations are recorded over time. Its central aim is to understand the underlying patterns, trends, and dependencies within the data and to make predictions about future values. Unlike other forms of data analysis, time series analysis focuses on the temporal ordering of data points, which is crucial in understanding how values evolve over time.
X, Crystal. 2025. “Learn Statistics with Python: Time Series Analysis in Statistics.” Medium. Medium. August 8. https://tracyrenee61.medium.com/learn-statistics-with-python-time-series-analysis-in-statistics-53f2a7467f57.
Visualisation
Learn statistics with Python: Visualisation
In the age of information, data is abundant and ever-growing. However, raw data alone often fails to convey meaningful insights. This is where visual techniques in statistics come into play. By transforming complex data into visual representations, statisticians and analysts can communicate findings more effectively, identify patterns, and make data-driven decisions.
X, Crystal. 2025. “Learn Statistics with Python: Visualisation.” Medium. Medium. August 5. https://tracyrenee61.medium.com/learn-statistics-with-python-visualisation-7e5b44e3360f.
Learn hypothesis testing with Python: Charts
Charts play a vital role in statistics and hypothesis testing, serving as powerful tools for understanding, analysing, and communicating data.
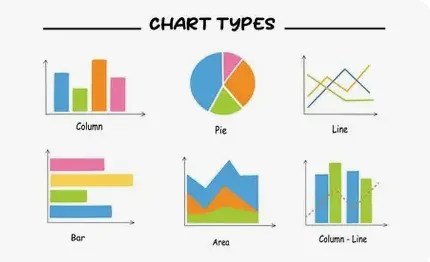
X, Crystal. 2025. “Learn Hypothesis Testing with Python: Charts.” Medium. August 23, 2025. https://tracyrenee61.medium.com/learn-hypothesis-testing-with-python-charts-b3538f372814.
Experimental Design
Statistical Experimental Design : The Framework of Scientific Inquiry
Statistical experimental design is a powerful tool that transforms curiosity into actionable knowledge. By adhering to principles such as randomisation, replication, and control, researchers can craft experiments that reveal cause-and-effect relationships with precision. Whether applied in medicine, engineering, agriculture, or business, experimental design not only minimizes uncertainty but also paves the way for innovation and progress. Its value as a scientific framework cannot be overstated — it is a catalyst for discovery and informed decision-making.
X, Crystal. 2025. “Statistical Experimental Design : The Framework of Scientific Inquiry.” Medium. Medium. March 20. https://tracyrenee61.medium.com/statistical-experimental-design-the-framework-of-scientific-inquiry-7aaf8d8f651b.
Learn statistics with Python: Experimental design
Statistical experimental design forms the backbone of empirical research, providing a systematic approach to investigating cause-and-effect relationships. Its methodology ensures that researchers can draw valid conclusions, minimise bias, and effectively allocate resources.
X, Crystal. 2025. “Learn Statistics with Python: Experimental Design.” Medium. Medium. August 10. https://tracyrenee61.medium.com/learn-statistics-with-python-experimental-design-333a8bc070df.
Ethics
Learn statistics with Python: Ethics
Statistics plays a critical role in understanding the world around us, aiding in decision-making across disciplines like healthcare, finance, education, and public policy. However, the power of statistics brings an inherent responsibility to ensure that the data, methods, and interpretations are used ethically.
X, Crystal. 2025. “Learn Statistics with Python: Ethics.” Medium. Medium. August 10. https://tracyrenee61.medium.com/learn-statistics-with-python-ethics-6f272454cd69.
 All articles are for Medium Member Only
The featured image on this page is a Creative Commons Licensed Clipboard Statistics Image.
