
Contents
- Analysis of Variance
- When would you use ANOVA?
- ANOVA Table
- Key Concepts and Formulas in ANOVA
- Steps in Conducting ANOVA
- Key Takeaways
- Performing an ANOVA Test
- Step 1: Define the hypothesis
- Step 2: Check ANOVA assumptions
- Step 3: Calculate ANOVA
- 1. Calculate the mean for each group and the overall mean.
- 2. Calculate the sum of squares for each group
- 3. Calculate the sum of squares between the group, the sum of squares within the group, and the total sum of squares.
- 4. Calculate the mean squares
- 5. Calculate the F-statistic using the equation below
- Step 4: Interpret the results
- References
- Additional Reading
- Normality
- Post Hoc Analysis
- Videos
Analysis of Variance
ANOVA
ANOVA (Analysis of Variance) is a statistical tool to test the homogeneity of different groups based on their differences. [1]
- ANOVA is the method of analyzing the variance in a set of data and dividing the variance into groups according to the sources of those variations.
- ANOVA is based on the principle that the total amount of differences in a set of data can be divided into two types, the amount that can be attributed to chance and the other that is caused due to specific causes.
- In a population, ANOVA is used to determine the difference between the means of the samples by analyzing the variation within each of the samples, and relative to the variation between the samples.
- While performing ANOVA, two assumptions are made where the first is that the samples are extracted from a normal population, and the second is that all factors other than those being tested are controlled.
Two-way ANOVA
- The two-way ANOVA technique is used in cases when the given set of data is classified under two different independent factors.
- Here, measurements are taken for each factor separately, and thus the measurements may or may not repeated values.
- The primary purpose of two-way ANOVA is to determine if there is a relation between the independent factors and the dependent factor.
- This technique helps us to determine if the effect of the independent factor on the dependent factor is influenced by the other independent factor or not.
Multivariate Analysis of Variance (MANOVA)
MANOVA is just an ANOVA with several dependent variables. It’s similar to many other tests and experiments in that it’s purpose is to find out if the response variable (i.e. your dependent variable) is changed by manipulating the independent variable. The test helps to answer many research questions, including: [3]
- What are the interactions among independent variables?
- Do changes to the independent variables have statistically significant effects on dependent variables?
- What are the interactions among dependent variables?
When would you use ANOVA?
ANOVA, or Analysis of Variance, is used when you want to compare the means of three or more groups to determine if there are statistically significant differences among them. Here are some specific scenarios when ANOVA is appropriate:
- Multiple Group Comparisons: When you have three or more groups to compare (e.g., testing the effectiveness of different teaching methods on student performance).
- Independent Samples: When the groups are independent of each other (e.g., comparing test scores from different classrooms).
- Continuous Dependent Variable: When your dependent variable is continuous (e.g., height, weight, test scores).
- Categorical Independent Variable: When your independent variable is categorical, such as group membership (e.g., treatment types, demographic categories).
- Testing Hypotheses: To test a null hypothesis that states there are no differences between group means.
- Checking Assumptions: ANOVA assumes normality and homogeneity of variances, so it’s used when these assumptions can be reasonably met.
- Post Hoc Analysis: If ANOVA indicates significant differences, you can follow up with post hoc tests to identify which specific groups differ from each other.
ANOVA is a powerful statistical tool for comparing multiple groups and understanding the influence of categorical independent variables on a continuous dependent variable.
ANOVA Table
ANOVA table is a tabular form of all the data and calculations performed during the test. This makes it more convenient for the observation and calculation of data.

c = number of columns
r = number of rows
T = the total of the values of individual items
Tj = the sum of the values in the column
Ti = the sum of the values in the row
- The ANOVA table shows the statistics used to test hypotheses about the population means.
- Here, the F-ratios for rows and columns are compared with their corresponding table values, for the given degree of freedom and given level of significance.
- If the calculated F-ratio is found to be equal or higher than its table value, the differences or variation among the columns are considered significant.
- A similar process is employed for rows to determine the significance of the variation.
Key Concepts and Formulas in ANOVA
Sum of Squares (SS): This measures the overall variability in the dataset.
- SS Total: Total variability across all observations.
- SS Between (SSB): Variability due to the differences between group means.
- SS Within (SSW): Variability within each group, showing how scores differ within individual groups.
Mean Square (MS): The average of squared deviations, calculated for both between-group and within-group variability.


Degrees of Freedom (df): The number of values that are free to vary when calculating statistics.
- df Between: df Between = k – 1, where k is the number of groups.
- df Within: df Within N – k, where N is the total number of observations.
F-Ratio: The ratio of MSB to MSW, used to test the null hypothesis.
The F-ratio is the ratio of the between-group variance (MSB) to the within-group variance (MSW). The calculated F-ratio can be compared to a table of critical F-ratios to determine whether there are any differences between groups.

P-Value: This probability value helps determine if the F-ratio is significant. A small p-value (e.g., <0.05) suggests significant differences between groups.
Steps in Conducting ANOVA
- State the Hypotheses
- Null Hypothesis (H₀): All group means are equal, indicating no significant difference.
- Alternative Hypothesis (H₁): At least one group mean differs significantly from the others.
- Calculate Sums of Squares
- Compute SS Total, SS Between, and SS Within.
- Calculate Mean Squares
- Divide each sum of squares by its respective degrees of freedom to obtain MSB and MSW.
- Compute the F-Ratio
- Divide MSB by MSW to calculate the F-ratio.
- Interpret the Results
- Compare the F-ratio to a critical value from the F-distribution or use the p-value to determine significance.
Key Takeaways
- ANOVA is a statistical formula used to compare variances across the means (or average) of different groups.
- There are two types of commonly used ANOVA; one-way ANOVA and two-way ANOVA.
- To analyze variance (ANOVA), statisticians or analysts use the F-test to compute the feasibility of variability amongst two groups more than the variations observed within the said groups under study.
Performing an ANOVA Test
See Performing an ANOVA Test on the ANOVA Test: An In-Depth Guide with Examples webpage. I have provided some additional information below for those learning ANOVA testing.
Step 1: Define the hypothesis
Identify the Research Question: Clearly articulate the question you want to answer through your research or experiment. Understand the context and objectives.
Determine the Variables: Identify the independent and dependent variables involved in your study. This helps clarify what you are measuring and what influences it.
Formulate the Null Hypothesis: State the null hypothesis (H0) as a clear and concise statement. It typically asserts that there is no effect, no difference, or no relationship between the variables.
Example: If you are testing a new drug, your null hypothesis might be: “The new drug does not affect patient recovery rates compared to the placebo.”
Consider the Alternative Hypothesis: While defining the null hypothesis, consider the alternative hypothesis (Ha or H1), representing what you aim to prove. Ensure it is distinct from the null hypothesis.
Example: “The new drug improves patient recovery rates compared to the placebo.”
Make it Testable: Ensure that the null hypothesis can be tested with your data. It should be specific enough to allow for statistical analysis. Avoid vague language; be precise about what you are testing.
Consult Relevant Literature: Review existing studies or literature on your topic to inform your hypothesis. This can provide insights into standard practices and established norms.
Refine as Necessary: Based on feedback from peers or advisors, refine your null hypothesis to ensure clarity and focus.
Step 2: Check ANOVA assumptions
Before performing ANOVA, ensure that the assumptions are met: normality, independence, and homogeneity of variances. For simplicity, let’s assume all the assumptions are met.
Step 3: Calculate ANOVA
1. Calculate the mean for each group and the overall mean.
2. Calculate the sum of squares for each group
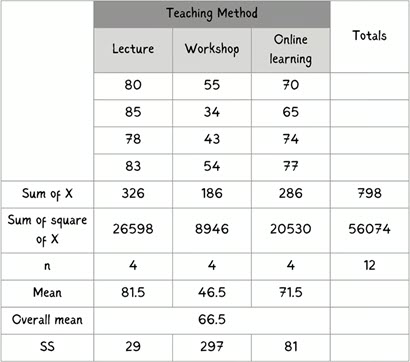
3. Calculate the sum of squares between the group, the sum of squares within the group, and the total sum of squares.
4. Calculate the mean squares
5. Calculate the F-statistic using the equation below
Using the computed F-statistic value of 28.747, we can determine the p-value using the F-statistic, df (degree of freedom), and F-distribution tables. The F-tables‡ provide the critical values for right-tail F-tests. Your F-test results are statistically significant when its test statistic is greater than this value.
F-distributions require both a numerator and denominator degrees of freedom (df) to define its shape. For example, F(3,2) indicates that the F-distribution has 3 numerator and 2 denominator degrees of freedom.
In the example, the numerator df is 2, the denominator df is 9, and the F-statistic is 28.747.
The F-distribution table webpage has two tables. The first one gives critical values of F at the p = 0.05 significance level, and the second table gives critical values of F at the p = 0.01 significance level.
- Obtain your F-statistic. This has (x, y) degrees of freedom associated with it.
- Go along x columns (numerator df) and down y rows (denominator df). The point of intersection is your critical F-ratio.
- If your obtained value of F is equal to or larger than this critical F-value, then your result is significant at that probability level p.
In each table, go along 2 columns and down 9 rows. The critical value of F is 4.256 (a=0.05) and 8.022 (a=0.01). The obtained F-ratio of 28.747 is larger than this, so I conclude that my obtained F-ratio is likely to occur by chance with a p<.05 or a p<.01.
Step 4: Interpret the results
- F-statistic: The F-statistic measures the ratio of between-group variation to within-group variation. A higher F-statistic indicates a more significant difference between group means relative to random variation.
- P-value: The p-value determines whether the differences between group means are statistically significant. If the p-value is below a predefined threshold (commonly 0.05), reject the null hypothesis and conclude that at least one group has a significantly different mean.
Given either p-value obtained above, we would reject the null hypothesis to conclude that the teaching method significantly affects exam scores.
‡ On this webpage you can either calculate the critical F-value or the p-value with given degrees of freedom. You can also read the critical F-value for a given alpha level in the tables.
References
[1] Sapkota, Anupama. 2023. “ANOVA: Definition, One-Way, Two-Way, Table, Examples, Uses.” Microbe Notes. August 3. https://microbenotes.com/anova/.
[2] Hassan, Muhammad. 2024. “ANOVA (Analysis of Variance) – Formulas, Types, and Examples.” Research Method. November 12. https://researchmethod.net/anova/.
[3] In statistics, the F-ratio refers to a calculated value used to compare variances between different groups in an analysis of variance (ANOVA), essentially representing the ratio of the variance between groups to the variance within groups; a large F-ratio indicates a significant difference between groups, suggesting that the observed variations are unlikely due to chance alone.
Key points about the F-ratio:
- Formula: F = (Variance between groups) / (Variance within groups)
- Interpretation:
- A large F-ratio suggests that the differences between groups are larger than the variations within each group, indicating a significant effect.
- An F-ratio close to 1 indicates that the variance between groups is similar to the variance within groups, suggesting no significant difference.
- Used in ANOVA: The F-ratio is primarily used in ANOVA tests to determine whether there are statistically significant differences between multiple groups.
[4] “ANOVA Test: Definition, Types, Examples, SPSS.” 2024. Statistics How To. October 6. https://www.statisticshowto.com/probability-and-statistics/hypothesis-testing/anova/.
An ANOVA test is a way to determine whether survey or experiment results are significant. In other words, they help you to figure out if you need to reject the null hypothesis or accept the alternate hypothesis. You’re testing groups to see if there’s a difference between them.
Additional Reading
“ANOVA Formula in Statistics with Solved Examples and FAQs.” 2024. GeeksforGeeks. GeeksforGeeks. August 8. https://www.geeksforgeeks.org/anova-formula/.
ANOVA Test, or Analysis of Variance, is a statistical method used to test the differences between means of two or more groups. Developed by Ronald Fisher in the early 20th century, ANOVA helps determine whether there are any statistically significant differences between the means of three or more independent groups. The ANOVA analysis is a statistical relevance tool designed to evaluate whether or not the null hypothesis can be rejected while testing hypotheses. It is used to determine whether or not the means of three or more groups are equal.
Frost, Jim. 2021. “Multivariate ANOVA (MANOVA) Benefits and When to Use It.” Statistics By Jim. September 17. https://statisticsbyjim.com/anova/multivariate-anova-manova-benefits-use/.
Multivariate ANOVA (MANOVA) extends the capabilities of analysis of variance (ANOVA) by assessing multiple dependent variables simultaneously. ANOVA statistically tests the differences between three or more group means. For example, if you have three different teaching methods and you want to evaluate the average scores for these groups, you can use ANOVA. However, ANOVA does have a drawback. It can assess only one dependent variable at a time. This limitation can be an enormous problem in certain circumstances because it can prevent you from detecting effects that actually exist.
Gurchetan. 2024. “What Is Analysis of Variance (ANOVA)?” Analytics Vidhya. December 16. https://www.analyticsvidhya.com/blog/2018/01/anova-analysis-of-variance/.
Analysis of Variance (ANOVA) is a statistical method that helps compare the averages of different groups. It is used in various situations to find out if there are any differences between these group averages.
A one-way ANOVA involves a single independent variable, whereas a two-way ANOVA involves two independent variables.
It is often used to determine whether there are any statistically significant differences between the means of different groups.
ANOVA compares the variation between group means to the variation within the groups. If the variation between group means is significantly larger than the variation within groups, it suggests a significant difference between the means of the groups.
ANOVA calculates an F-statistic by comparing between-group variability to within-group variability. If the F-statistic exceeds a critical value, it indicates significant differences between group means.
ANOVA is used to compare treatments, analyze factors impact on a variable, or compare means across multiple groups.
Types of ANOVA include one-way (for comparing means of groups) and two-way (for examining effects of two independent variables on a dependent variable).
Hassan, Muhammad. 2024. “MANOVA (Multivariate Analysis of Variance) – Method & Examples.” Research Method. November 11. https://researchmethod.net/manova/.
Multivariate Analysis of Variance (MANOVA) is an extension of ANOVA (Analysis of Variance) that allows researchers to simultaneously test the impact of independent variables on multiple dependent variables. MANOVA is valuable when a study involves multiple related outcome variables likely influenced by the same factors. By analyzing these relationships in a single analysis, MANOVA provides a more comprehensive understanding of the effects and interactions of variables.
Jesussek, Dr. Mathias and Dr. Hannah Volk-Jesussek. “Statistics made easy: A clear and simple introduction.” 5th edition. (DATAtab e.U., Graz, 2024), 201-243.
This book provides an overview of key topics in statistics. The main methods and features of descriptive and inferential statistics are described and illustrated with graphics. In addition, the book offers step-by-step explanations for data analysis with the statistics software numiqo (numiqo.com). The aim is to present the background of the statistical methods and their implementation in numiqo in an easy-to-understand and clear way. We start with the basics of descriptive and inferential statistics, their differences, and applications. An introduction to the central basic concepts of statistics follows this. The focus is on the concepts of variable or characteristic, scale or level of measurement, sample, population, and complete survey. We then move on to statistical procedures for testing for differences in more than two groups and look at various forms of analysis of variance. Building on this, we look at statistical techniques for testing correlations and explore the field of correlation analysis and partial correlations. Finally, we look at regression with linear and logistic regression examples. We conclude with structure discovery methods such as factor analysis and k-means cluster analysis. Throughout the book, we explain why each term or method is important, at what point in the research process it is relevant, and what questions it can answer.
Lane, David. “15.1: Introduction to ANOVA.” 2022. Statistics LibreTexts. Libretexts. April 23. https://stats.libretexts.org/Bookshelves/Introductory_Statistics/Introductory_Statistics_(Lane)/15%3A_Analysis_of_Variance/15.01%3A_Introduction_to_ANOVA.
Analysis of Variance (ANOVA) is a statistical method used to test differences between two or more means. It may seem odd that the technique is called “Analysis of Variance” rather than “Analysis of Means.” As you will see, the name is appropriate because inferences about means are made by analyzing variance.
“MANOVA (Multivariate Analysis of Variance).” 2023. GeeksforGeeks. GeeksforGeeks. November 5. https://www.geeksforgeeks.org/manova-multivariate-analysis-of-variance/.
The statistical technique known as multivariate analysis of variance, or MANOVA, expands the application of analysis of variance (ANOVA) to scenarios involving several dependent variables. It is an effective and adaptable instrument frequently used in many disciplines, such as the social sciences, biology, psychology, and Data Sciences. MANOVA facilitates investigating and comprehending the responses of several linked dependent variables to changes in one or more independent variables by researchers. ANOVA can only handle one dependent variable at a time; in contrast, MANOVA allows you to evaluate the combined effects of several dependent variables in a single analysis.
The main objective of a MANOVA is to find significant differences between groups defined by the independent variables with respect to a set of dependent variables. Because of this, it is especially helpful when researchers are working with complicated data sets and need to consider interdependencies between the results.
One of MANOVA’s main advantages is that it takes into account the relationships between dependent variables—something that ANOVA is unable to do. It offers a more thorough comprehension of how modifications to the independent variable or variables affect the overall response pattern across the dependent variables.
“The Ultimate Guide to ANOVA.” 2025. GraphPad. Accessed February 6. https://www.graphpad.com/guides/the-ultimate-guide-to-anova.
ANOVA, or (Fisher’s) analysis of variance, is a critical analytical technique for evaluating differences between three or more sample means from an experiment. As the name implies, it partitions out the variance in the response variable based on one or more explanatory factors. As you will see, there are many types of ANOVA, such as one-, two-, and three-way ANOVA, as well as nested and repeated measures ANOVA.
Thevapalan, Arunn. 2024. “ANOVA Test: An In-Depth Guide with Examples.” DataCamp. DataCamp. September 20. https://www.datacamp.com/tutorial/anova-test.
The one-way ANOVA test will tell us if the variation in student exam scores can be attributed to the differences in teaching methods or if it’s likely due to random chance. One-way ANOVA is effective when analyzing the impact of a single factor across multiple groups, making it simpler to interpret. However, it does not account for the possibility of interaction between multiple independent variables, where two-way ANOVA becomes necessary.
Normality
One of the most common requirements for statistical test procedures is that the data used must be normally distributed. For example, if a t-test or an ANOVA is to be calculated, it must first be tested whether the data or variables are normally distributed. This is done with a test of normality.
If the normal distribution of the data is not given, the above procedures cannot be used and the non-parametric tests, which do not require normal distribution of the data, must be used. How do I test normal distribution? Normal distribution can be tested either analytically or graphically. The most common analytical tests to check data for normal distribution are the:
For the graphical test either a histogram or the Q-Q plot is used. Q-Q stands for Quantile Quantile Plot, it compares the actual observed distribution and the expected theoretical distribution.
Post Hoc Analysis
A post hoc analysis is a statistical analysis that is performed after the data has been collected and a study has concluded. The term comes from the Latin phrase post hoc, which means “after this”.
Purpose
- Post hoc analyses are used to identify differences between groups
- They can help determine which pairwise comparisons of means contribute to the overall comparison
- They can help identify statistical relationships that suggest cause and effect
When used
- Post hoc analyses are often used when an analysis of variance test is significant
- They can be used to analyze data from clinical trials
- They can be used to explore associations between variables that were not originally considered
Limitations
- Post hoc analyses can be unplanned, and the results of unplanned analyses may be overvalued
- The risk of overvaluing unplanned analyses is that the results may be used to make conclusions that are not warranted
Types of post hoc tests
- Newman-Keuls is a post hoc test that compares pairs of means using different critical values
Pamplona, Fabricio. 2024. “Post Hoc Analysis: Process and Types of Tests.” Mind the Graph Blog. December 5. https://mindthegraph.com/blog/post-hoc-analysis/.
“Post Hoc Analysis.” 2024. Wikipedia. Wikimedia Foundation. December 29. https://en.wikipedia.org/wiki/Post_hoc_analysis.
“Post Hoc Analysis.” 2023. Association of Health Care Journalists. November 9. https://healthjournalism.org/glossary-terms/post-hoc-analysis/.
“Post Hoc Analysis.” 2025. Post Hoc Analysis – an Overview | ScienceDirect Topics. Accessed February 14. https://www.sciencedirect.com/topics/nursing-and-health-professions/post-hoc-analysis.
“What Is the Significance and Use of Post-Hoc Analysis Studies?” 2025. Mind the Graph. Accessed February 14. https://www.cwauthors.com/article/significance-and-use-of-post-hoc-analysis-studies.
Videos
The featured image on this page is from the ResearchMethod.Net website.
